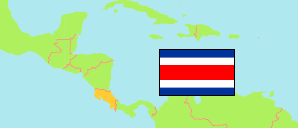
Zaragoza
District in Costa Rica
Contents: Population
The population development of Zaragoza as well as related information and services (Wikipedia, Google, images).
| Name | Status | Population Estimate 2000-06-30 | Population Estimate 2011-06-30 | Population Projection 2020-06-30 | |
|---|---|---|---|---|---|
| Zaragoza | District | 7,617 | 8,589 | 9,681 | |
| Costa Rica | Republic | 3,872,343 | 4,592,147 | 5,111,221 |
Source: Instituto Nacional de Estadística y Censos.
Further information about the population structure:
| Gender (P 2020) | |
|---|---|
| Males | 4,834 |
| Females | 4,847 |
| Age Groups (P 2020) | |
|---|---|
| 0-14 years | 1,897 |
| 15-64 years | 6,754 |
| 65+ years | 1,030 |
| Age Distribution (P 2020) | |
|---|---|
| 0-9 years | 1,242 |
| 10-19 years | 1,305 |
| 20-29 years | 1,569 |
| 30-39 years | 1,661 |
| 40-49 years | 1,209 |
| 50-59 years | 1,170 |
| 60-69 years | 870 |
| 70+ years | 655 |
| Urbanization (C 2011) | |
|---|---|
| Rural | 836 |
| Urban | 7,383 |