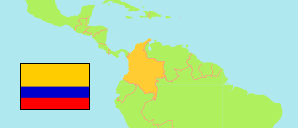
Zapayán
Municipality in Magdalena
Municipality
The population development of Zapayán.
| Name | Status | Population Census 2005-06-30 | Population Census 2018-06-30 | |
|---|---|---|---|---|
| Zapayán | Municipality | 8,642 | 9,895 | → |
| Magdalena | Department | 1,159,616 | 1,231,539 |
Contents: Urban Localities
The population development of the urban localities in Zapayán.
| Name | Status | Municipality | Population Census 2005-06-30 | Population Census 2018-06-30 | |
|---|---|---|---|---|---|
| Caño de Aguas | Population Center | Zapayán | 560 | 659 | → |
| Capucho | Population Center | Zapayán | 430 | 382 | → |
| El Bongo | Population Center | Zapayán | ... | 156 | → |
| Los Cerritos | Population Center | Zapayán | 174 | 183 | → |
| Piedras de Moler | Population Center | Zapayán | 1,435 | 1,654 | → |
| Piedras Pintadas | Population Center | Zapayán | 1,010 | 1,131 | → |
| Punta de Piedras | Capital | Zapayán | 3,238 | 3,846 | → |
Source: Departamento Administrativo Nacional de Estadistica, Republica de Columbia (web).
Explanation: In constrast to municipalities and their capitals, the population figures of population centers are not adjusted for underenumeration.