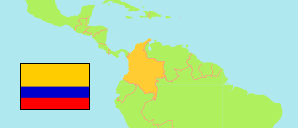
El Banco
Municipality in Magdalena
Municipality
The population development of El Banco.
| Name | Status | Population Census 2005-06-30 | Population Census 2018-06-30 | |
|---|---|---|---|---|
| El Banco | Municipality | 54,855 | 65,457 | → |
| Magdalena | Department | 1,159,616 | 1,231,539 |
Contents: Urban Localities
The population development of the urban localities in El Banco.
| Name | Status | Municipality | Population Census 2005-06-30 | Population Census 2018-06-30 | |
|---|---|---|---|---|---|
| Aguaestrada | Population Center | El Banco | 592 | 914 | → |
| Algarrobal | Population Center | El Banco | 586 | 790 | → |
| Belén | Population Center | El Banco | 2,081 | 2,173 | → |
| Botillero | Population Center | El Banco | 328 | 398 | → |
| Caño de Palma | Population Center | El Banco | 719 | 819 | → |
| El Banco | Capital | El Banco | 33,027 | 41,881 | → |
| El Barranco de Chilloa | Population Center | El Banco | 390 | 608 | → |
| El Cedro | Population Center | El Banco | ... | 255 | → |
| El Cerrito | Population Center | El Banco | 1,317 | 1,475 | → |
| El Trébol | Population Center | El Banco | 638 | 766 | → |
| Garzón | Population Center | El Banco | 246 | 283 | → |
| Guacamayal | Population Center | El Banco | 237 | 262 | → |
| Hatillo de la Sabana | Population Center | El Banco | 638 | 600 | → |
| Islitas | Population Center | El Banco | 226 | 142 | → |
| Los Negritos | Population Center | El Banco | 701 | 981 | → |
| Malpica | Population Center | El Banco | 470 | 472 | → |
| Mata de Caña | Population Center | El Banco | 386 | 491 | → |
| Menchiquejo | Population Center | El Banco | 734 | 674 | → |
| Pueblo Nuevo | Population Center | El Banco | 234 | 216 | → |
| San Felipe y San Eduardo | Population Center | El Banco | 1,715 | 1,848 | → |
| San José | Population Center | El Banco | 338 | 333 | → |
| San Roque | Population Center | El Banco | 683 | 719 | → |
| Tamalamequito | Population Center | El Banco | 1,050 | 1,030 | → |
Source: Departamento Administrativo Nacional de Estadistica, Republica de Columbia (web).
Explanation: In constrast to municipalities and their capitals, the population figures of population centers are not adjusted for underenumeration.