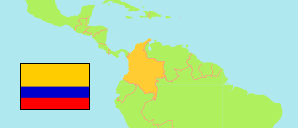
San Pelayo
Municipality in Córdoba
Municipality
The population development of San Pelayo.
| Name | Status | Population Census 2005-06-30 | Population Census 2018-06-30 | |
|---|---|---|---|---|
| San Pelayo | Municipality | 39,260 | 51,838 | → |
| Córdoba | Department | 1,524,536 | 1,636,683 |
Contents: Urban Localities
The population development of the urban localities in San Pelayo.
| Name | Status | Municipality | Population Census 2005-06-30 | Population Census 2018-06-30 | |
|---|---|---|---|---|---|
| Bongas Mellas | Population Center | San Pelayo | ... | 256 | → |
| Buenos Aires | Population Center | San Pelayo | 336 | 239 | → |
| Carrillo | Population Center | San Pelayo | 2,681 | 3,169 | → |
| Corocito | Population Center | San Pelayo | ... | 299 | → |
| El Bálsamo | Population Center | San Pelayo | ... | 183 | → |
| El Bongo | Population Center | San Pelayo | ... | 382 | → |
| El Chiqui | Population Center | San Pelayo | ... | 175 | → |
| El Corozo | Population Center | San Pelayo | ... | 160 | → |
| El Obligado | Population Center | San Pelayo | 375 | 369 | → |
| La Madera | Population Center | San Pelayo | 866 | 988 | → |
| Las Guamas | Population Center | San Pelayo | 408 | 565 | → |
| Las Lauras | Population Center | San Pelayo | ... | 144 | → |
| Morrocoy | Population Center | San Pelayo | ... | 159 | → |
| Pelayito | Population Center | San Pelayo | 687 | 829 | → |
| Providencia | Population Center | San Pelayo | ... | 232 | → |
| Puerto Nuevo | Population Center | San Pelayo | 585 | 1,045 | → |
| Retiro | Population Center | San Pelayo | ... | 206 | → |
| Sabana Nueva | Population Center | San Pelayo | 303 | 276 | → |
| San Isidro | Population Center | San Pelayo | 678 | 862 | → |
| San Pelayo | Capital | San Pelayo | 7,260 | 9,105 | → |
| Valparaíso | Population Center | San Pelayo | 685 | 809 | → |
Source: Departamento Administrativo Nacional de Estadistica, Republica de Columbia (web).
Explanation: In constrast to municipalities and their capitals, the population figures of population centers are not adjusted for underenumeration.