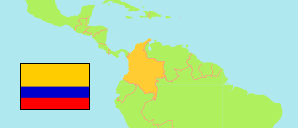
Yopal
Municipality in Casanare
Municipality
The population development of Yopal.
| Name | Status | Population Census 2005-06-30 | Population Census 2018-06-30 | |
|---|---|---|---|---|
| Yopal | Municipality | 106,822 | 168,433 | → |
| Casanare | Department | 295,821 | 341,508 |
Contents: Urban Localities
The population development of the urban localities in Yopal.
| Name | Status | Municipality | Population Census 2005-06-30 | Population Census 2018-06-30 | |
|---|---|---|---|---|---|
| El Charte | Population Center | Yopal | ... | 329 | → |
| El Morro | Population Center | Yopal | 596 | 1,232 | → |
| La Chaparrera | Population Center | Yopal | 1,444 | 1,940 | → |
| La Guafilla | Population Center | Yopal | 500 | 507 | → |
| La Llanerita | Population Center | Yopal | 33 | 45 | → |
| La Niata | Population Center | Yopal | ... | 258 | → |
| Punto Nuevo | Population Center | Yopal | ... | 72 | → |
| Quebrada Seca | Population Center | Yopal | ... | 166 | → |
| Santafé de Morichal | Population Center | Yopal | 945 | 1,827 | → |
| Tilodirán | Population Center | Yopal | 245 | 443 | → |
| Yopal | Capital | Yopal | 93,697 | 143,619 | → |
Source: Departamento Administrativo Nacional de Estadistica, Republica de Columbia (web).
Explanation: In constrast to municipalities and their capitals, the population figures of population centers are not adjusted for underenumeration.