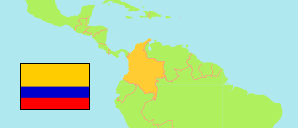
Amazonas
Department in Colombia
Contents: Subdivision
The population development in Amazonas as well as related information and services (Wikipedia, Google, images).
| Name | Status | Population Estimate 2005-06-30 | Population Estimate 2010-06-30 | Population Estimate 2015-06-30 | Population Projection 2020-06-30 | |
|---|---|---|---|---|---|---|
| Amazonas | Department | 47,830 | 56,747 | 67,862 | 80,472 | |
| El Encanto | Area | 3,343 | 4,026 | 3,241 | 2,078 | → |
| La Chorrera | Area | 1,562 | 2,062 | 2,599 | 3,040 | → |
| La Pedrera | Area | 907 | 1,149 | 2,767 | 3,985 | → |
| La Victoria | Area | 744 | 867 | 552 | 658 | → |
| Leticia | Municipality | 30,101 | 35,856 | 42,600 | 50,950 | → |
| Mirití - Paraná | Area | 1,246 | 1,506 | 1,621 | 1,867 | → |
| Puerto Alegría | Area | 969 | 1,141 | 662 | 754 | → |
| Puerto Arica | Area | 1,034 | 710 | 880 | 1,031 | → |
| Puerto Nariño | Area | 5,656 | 6,668 | 8,434 | 10,234 | → |
| Puerto Santander | Area | 406 | 515 | 1,541 | 1,828 | → |
| Tarapacá | Area | 1,862 | 2,247 | 2,965 | 4,047 | → |
| Colombia | Republic | 41,927,699 | 44,349,775 | 46,431,100 | 50,407,647 |
Source: Departamento Administrativo Nacional de Estadistica, Republica de Columbia.
Explanation: Municipalities as defined in 2020. All population figures consider the result of the 2018 census.
Further information about the population structure:
| Gender (E 2020) | |
|---|---|
| Males | 41,631 |
| Females | 38,841 |
| Age Groups (E 2020) | |
|---|---|
| 0-14 years | 29,007 |
| 15-64 years | 47,418 |
| 65+ years | 4,047 |
| Age Distribution (E 2020) | |
|---|---|
| 80+ years | 1,117 |
| 70-79 years | 1,505 |
| 60-69 years | 3,338 |
| 50-59 years | 5,381 |
| 40-49 years | 7,702 |
| 30-39 years | 10,686 |
| 20-29 years | 13,273 |
| 10-19 years | 17,995 |
| 0-9 years | 19,475 |