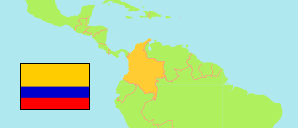
Magdalena
Department in Colombia
Contents: Subdivision
The population development in Magdalena as well as related information and services (Wikipedia, Google, images).
| Name | Status | Population Estimate 2005-06-30 | Population Estimate 2010-06-30 | Population Estimate 2015-06-30 | Population Projection 2020-06-30 | |
|---|---|---|---|---|---|---|
| Magdalena | Department | 1,159,616 | 1,231,539 | 1,281,842 | 1,426,023 | |
| Algarrobo | Municipality | 11,699 | 12,391 | 13,482 | 16,622 | → |
| Aracataca | Municipality | 35,733 | 37,787 | 39,143 | 42,497 | → |
| Ariguaní | Municipality | 31,236 | 31,184 | 31,212 | 32,096 | → |
| Cerro de San Antonio | Municipality | 8,191 | 9,095 | 9,469 | 10,549 | → |
| Chivolo (Chibolo) | Municipality | 16,282 | 17,233 | 19,698 | 23,374 | → |
| Ciénaga | Municipality | 103,191 | 109,505 | 114,444 | 126,370 | → |
| Concordia | Municipality | 10,161 | 10,459 | 10,361 | 11,168 | → |
| El Banco | Municipality | 54,605 | 60,021 | 62,552 | 69,696 | → |
| El Piñón | Municipality | 17,080 | 20,450 | 21,700 | 24,091 | → |
| El Retén | Municipality | 18,851 | 17,976 | 18,748 | 20,776 | → |
| Fundación | Municipality | 57,164 | 60,499 | 61,951 | 70,639 | → |
| Guamal | Municipality | 24,725 | 26,097 | 26,818 | 28,418 | → |
| Nueva Granada | Municipality | 16,383 | 17,342 | 18,828 | 21,045 | → |
| Pedraza | Municipality | 8,060 | 8,708 | 8,994 | 9,845 | → |
| Pijiño del Carmen | Municipality | 14,100 | 13,353 | 11,962 | 12,835 | → |
| Pivijay | Municipality | 36,150 | 38,155 | 38,508 | 39,594 | → |
| Plato | Municipality | 49,758 | 56,867 | 59,336 | 65,962 | → |
| Puebloviejo | Municipality | 25,419 | 26,828 | 28,133 | 32,022 | → |
| Remolino | Municipality | 7,929 | 10,465 | 10,945 | 12,145 | → |
| Sabanas de San Ángel | Municipality | 14,682 | 15,494 | 15,776 | 16,660 | → |
| Salamina | Municipality | 8,442 | 8,983 | 10,414 | 11,416 | → |
| San Sebastián de Buenavista | Municipality | 18,386 | 19,384 | 19,746 | 20,919 | → |
| Santa Ana | Municipality | 23,288 | 24,631 | 25,642 | 26,585 | → |
| Santa Bárbara de Pinto | Municipality | 11,025 | 9,720 | 10,105 | 11,127 | → |
| Santa Marta | Municipality | 421,911 | 445,056 | 466,106 | 530,107 | → |
| San Zenón | Municipality | 8,858 | 11,118 | 11,417 | 12,559 | → |
| Sitionuevo | Municipality | 27,385 | 25,509 | 26,162 | 28,959 | → |
| Tenerife | Municipality | 12,509 | 13,220 | 13,579 | 14,012 | → |
| Zapayán | Municipality | 8,663 | 9,148 | 9,540 | 10,462 | → |
| Zona Bananera | Municipality | 57,750 | 64,861 | 67,071 | 73,473 | → |
| Colombia | Republic | 41,927,699 | 44,349,775 | 46,431,100 | 50,407,647 |
Source: Departamento Administrativo Nacional de Estadistica, Republica de Columbia.
Explanation: Municipalities as defined in 2020. All population figures consider the result of the 2018 census.
Further information about the population structure:
| Gender (E 2020) | |
|---|---|
| Males | 713,399 |
| Females | 712,624 |
| Age Groups (E 2020) | |
|---|---|
| 0-14 years | 400,711 |
| 15-64 years | 915,450 |
| 65+ years | 109,862 |
| Age Distribution (E 2020) | |
|---|---|
| 80+ years | 23,471 |
| 70-79 years | 46,710 |
| 60-69 years | 90,200 |
| 50-59 years | 134,179 |
| 40-49 years | 163,817 |
| 30-39 years | 196,333 |
| 20-29 years | 237,983 |
| 10-19 years | 268,995 |
| 0-9 years | 264,335 |