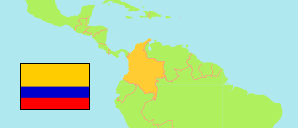
La Guajira
Department in Colombia
Contents: Subdivision
The population development in La Guajira as well as related information and services (Wikipedia, Google, images).
| Name | Status | Population Estimate 2005-06-30 | Population Estimate 2010-06-30 | Population Estimate 2015-06-30 | Population Projection 2020-06-30 | |
|---|---|---|---|---|---|---|
| La Guajira | Department | 565,770 | 670,808 | 778,983 | 964,067 | |
| Albania | Municipality | 16,618 | 20,037 | 24,047 | 32,308 | → |
| Barrancas | Municipality | 22,932 | 27,533 | 31,638 | 39,510 | → |
| Dibulla | Municipality | 19,186 | 23,570 | 29,264 | 42,157 | → |
| Distracción | Municipality | 10,388 | 12,404 | 11,998 | 14,210 | → |
| El Molino | Municipality | 6,244 | 7,312 | 7,829 | 7,830 | → |
| Fonseca | Municipality | 22,924 | 38,075 | 41,799 | 46,607 | → |
| Hatonuevo | Municipality | 12,709 | 15,263 | 17,452 | 22,071 | → |
| La Jagua del Pilar | Municipality | 2,285 | 2,765 | 3,086 | 3,804 | → |
| Maicao | Municipality | 88,066 | 113,489 | 151,660 | 185,999 | → |
| Manaure | Municipality | 58,936 | 69,794 | 63,883 | 90,687 | → |
| Riohacha | Municipality | 144,511 | 149,950 | 167,339 | 206,087 | → |
| San Juan del Cesar | Municipality | 25,439 | 30,870 | 42,864 | 51,027 | → |
| Uribia | Municipality | 103,917 | 117,868 | 143,102 | 179,188 | → |
| Urumita | Municipality | 11,518 | 14,153 | 13,738 | 11,791 | → |
| Villanueva | Municipality | 20,097 | 27,725 | 29,284 | 30,791 | → |
| Colombia | Republic | 41,927,699 | 44,349,775 | 46,431,100 | 50,407,647 |
Source: Departamento Administrativo Nacional de Estadistica, Republica de Columbia.
Explanation: Municipalities as defined in 2020. All population figures consider the result of the 2018 census.
Further information about the population structure:
| Gender (E 2020) | |
|---|---|
| Males | 472,935 |
| Females | 491,132 |
| Age Groups (E 2020) | |
|---|---|
| 0-14 years | 324,935 |
| 15-64 years | 589,950 |
| 65+ years | 49,182 |
| Age Distribution (E 2020) | |
|---|---|
| 80+ years | 10,947 |
| 70-79 years | 20,586 |
| 60-69 years | 42,062 |
| 50-59 years | 68,103 |
| 40-49 years | 94,060 |
| 30-39 years | 132,037 |
| 20-29 years | 172,744 |
| 10-19 years | 201,092 |
| 0-9 years | 222,436 |