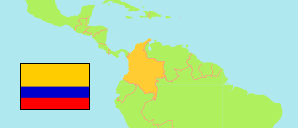
Cesar
Department in Colombia
Contents: Subdivision
The population development in Cesar as well as related information and services (Wikipedia, Google, images).
| Name | Status | Population Estimate 2005-06-30 | Population Estimate 2010-06-30 | Population Estimate 2015-06-30 | Population Projection 2020-06-30 | |
|---|---|---|---|---|---|---|
| Cesar | Department | 913,960 | 1,003,449 | 1,102,461 | 1,290,919 | |
| Aguachica | Municipality | 84,079 | 91,773 | 100,295 | 118,392 | → |
| Agustín Codazzi | Municipality | 54,314 | 55,601 | 60,068 | 65,428 | → |
| Astrea | Municipality | 18,466 | 19,010 | 19,838 | 21,547 | → |
| Becerril | Municipality | 14,219 | 16,457 | 19,885 | 23,265 | → |
| Bosconia | Municipality | 31,454 | 33,883 | 36,312 | 43,191 | → |
| Chimichagua | Municipality | 31,437 | 33,759 | 34,388 | 36,683 | → |
| Chiriguaná | Municipality | 22,340 | 25,759 | 26,779 | 29,804 | → |
| Curumaní | Municipality | 27,892 | 31,575 | 34,530 | 40,205 | → |
| El Copey | Municipality | 25,433 | 28,346 | 30,189 | 32,335 | → |
| El Paso | Municipality | 21,190 | 22,900 | 31,155 | 40,398 | → |
| Gamarra | Municipality | 14,812 | 16,134 | 15,509 | 16,104 | → |
| González | Municipality | 9,182 | 9,770 | 5,375 | 4,594 | → |
| La Gloria | Municipality | 14,736 | 15,875 | 16,403 | 18,440 | → |
| La Jagua de Ibirico | Municipality | 22,198 | 29,925 | 36,460 | 50,338 | → |
| La Paz | Municipality | 21,498 | 24,404 | 26,276 | 29,873 | → |
| Manaure Balcón del Cesar | Municipality | 7,174 | 8,283 | 9,163 | 10,850 | → |
| Pailitas | Municipality | 16,185 | 17,838 | 18,529 | 19,963 | → |
| Pelaya | Municipality | 16,074 | 17,393 | 19,073 | 22,318 | → |
| Pueblo Bello | Municipality | 17,688 | 19,239 | 23,700 | 29,017 | → |
| Río de Oro | Municipality | 14,638 | 15,887 | 16,746 | 18,073 | → |
| San Alberto | Municipality | 20,451 | 22,516 | 24,467 | 28,280 | → |
| San Diego | Municipality | 13,978 | 15,367 | 16,998 | 20,406 | → |
| San Martín | Municipality | 17,733 | 20,598 | 23,056 | 28,718 | → |
| Tamalameque | Municipality | 14,225 | 14,801 | 15,281 | 16,459 | → |
| Valledupar | Municipality | 362,564 | 396,356 | 441,986 | 526,238 | → |
| Colombia | Republic | 41,927,699 | 44,349,775 | 46,431,100 | 50,407,647 |
Source: Departamento Administrativo Nacional de Estadistica, Republica de Columbia.
Explanation: Municipalities as defined in 2020. All population figures consider the result of the 2018 census.
Further information about the population structure:
| Gender (E 2020) | |
|---|---|
| Males | 639,132 |
| Females | 651,787 |
| Age Groups (E 2020) | |
|---|---|
| 0-14 years | 378,169 |
| 15-64 years | 827,236 |
| 65+ years | 85,514 |
| Age Distribution (E 2020) | |
|---|---|
| 80+ years | 17,141 |
| 70-79 years | 37,086 |
| 60-69 years | 71,318 |
| 50-59 years | 112,594 |
| 40-49 years | 147,260 |
| 30-39 years | 185,919 |
| 20-29 years | 220,635 |
| 10-19 years | 245,694 |
| 0-9 years | 253,272 |