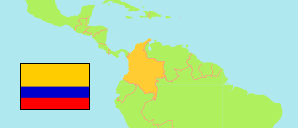
Caldas
Department in Colombia
Contents: Subdivision
The population development in Caldas as well as related information and services (Wikipedia, Google, images).
| Name | Status | Population Estimate 2005-06-30 | Population Estimate 2010-06-30 | Population Estimate 2015-06-30 | Population Projection 2020-06-30 | |
|---|---|---|---|---|---|---|
| Caldas | Department | 937,172 | 945,605 | 969,209 | 1,021,435 | |
| Aguadas | Municipality | 23,161 | 22,162 | 22,715 | 23,116 | → |
| Anserma | Municipality | 35,016 | 35,510 | 34,674 | 36,803 | → |
| Aranzazu | Municipality | 12,677 | 12,883 | 12,011 | 10,683 | → |
| Belalcázar | Municipality | 11,814 | 11,362 | 10,661 | 10,761 | → |
| Chinchiná | Municipality | 53,587 | 51,758 | 51,725 | 52,381 | → |
| Filadelfia | Municipality | 12,726 | 11,992 | 11,519 | 11,554 | → |
| La Dorada | Municipality | 73,659 | 69,309 | 69,627 | 73,645 | → |
| La Merced | Municipality | 6,572 | 6,632 | 6,369 | 6,142 | → |
| Manizales | Municipality | 385,025 | 397,951 | 422,715 | 445,669 | → |
| Manzanares | Municipality | 18,929 | 19,395 | 19,184 | 18,345 | → |
| Marmato | Municipality | 8,497 | 8,567 | 8,439 | 9,068 | → |
| Marquetalia | Municipality | 14,501 | 12,994 | 13,214 | 13,443 | → |
| Marulanda | Municipality | 2,792 | 2,838 | 2,798 | 2,662 | → |
| Neira | Municipality | 28,284 | 28,518 | 22,803 | 21,287 | → |
| Norcasia | Municipality | 6,783 | 6,461 | 5,945 | 6,065 | → |
| Pácora | Municipality | 15,028 | 14,914 | 15,275 | 15,509 | → |
| Palestina | Municipality | 17,908 | 16,774 | 15,684 | 15,757 | → |
| Pensilvania | Municipality | 24,521 | 24,761 | 21,449 | 20,063 | → |
| Riosucio | Municipality | 37,350 | 38,814 | 43,075 | 52,466 | → |
| Risaralda | Municipality | 10,563 | 11,016 | 10,873 | 11,057 | → |
| Salamina | Municipality | 19,108 | 20,309 | 20,297 | 19,707 | → |
| Samaná | Municipality | 18,983 | 20,056 | 20,420 | 20,912 | → |
| San José | Municipality | 6,143 | 5,213 | 4,871 | 4,854 | → |
| Supía | Municipality | 25,054 | 25,472 | 26,484 | 29,319 | → |
| Victoria | Municipality | 9,129 | 9,298 | 9,632 | 10,302 | → |
| Villamaría | Municipality | 46,959 | 47,989 | 53,714 | 66,914 | → |
| Viterbo | Municipality | 12,403 | 12,657 | 13,036 | 12,951 | → |
| Colombia | Republic | 41,927,699 | 44,349,775 | 46,431,100 | 50,407,647 |
Source: Departamento Administrativo Nacional de Estadistica, Republica de Columbia.
Explanation: Municipalities as defined in 2020. All population figures consider the result of the 2018 census.
Further information about the population structure:
| Gender (E 2020) | |
|---|---|
| Males | 494,631 |
| Females | 526,804 |
| Age Groups (E 2020) | |
|---|---|
| 0-14 years | 195,848 |
| 15-64 years | 694,588 |
| 65+ years | 130,999 |
| Age Distribution (E 2020) | |
|---|---|
| 80+ years | 26,962 |
| 70-79 years | 57,205 |
| 60-69 years | 105,222 |
| 50-59 years | 131,871 |
| 40-49 years | 129,642 |
| 30-39 years | 142,887 |
| 20-29 years | 157,795 |
| 10-19 years | 141,442 |
| 0-9 years | 128,409 |