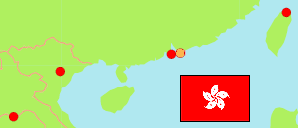
Sai Kung
District Council in Hong Kong
Contents: Subdivision
The population development in Sai Kung as well as related information and services (Wikipedia, Google, images).
| Name | Status | Native | Population Census 2016-06-30 | Population Census 2021-06-30 | |
|---|---|---|---|---|---|
| Sai Kung | District Council | 西貢區 | 461,864 | 489,037 | |
| Choi Kin | Constituency Area | 彩健 | 19,949 | 18,380 | → |
| Do Shin | Constituency Area | 都善 | 15,882 | 15,295 | → |
| Fu Kwan | Constituency Area | 富君 | 19,159 | 18,938 | → |
| Fu Nam | Constituency Area | 富藍 | 17,074 | 16,665 | → |
| Hang Hau East | Constituency Area | 坑口東 | 14,102 | 16,447 | → |
| Hang Hau West | Constituency Area | 坑口西 | 16,633 | 20,082 | → |
| Hau Tak | Constituency Area | 厚德 | 17,872 | 17,611 | → |
| Hoi Chun | Constituency Area | 海晉 | ... | 23,777 | → |
| Hong King | Constituency Area | 康景 | ... | 12,545 | → |
| King Lam | Constituency Area | 景林 | 16,893 | 15,419 | → |
| Kin Ming | Constituency Area | 健明 | 15,631 | 15,773 | → |
| Kwan Po | Constituency Area | 軍寶 | 14,856 | 13,467 | → |
| Kwong Ming | Constituency Area | 廣明 | 17,566 | 16,585 | → |
| Nam On | Constituency Area | 南安 | 19,558 | 17,097 | → |
| O Tong | Constituency Area | 澳唐 | 18,557 | 18,046 | → |
| Pak Sha Wan | Constituency Area | 白沙灣 | 16,550 | 16,829 | → |
| Po Lam | Constituency Area | 寶林 | 15,368 | 14,084 | → |
| Po Yee | Constituency Area | 寶怡 | ... | 14,765 | → |
| Sai Kung Central | Constituency Area | 西貢市中心 | 9,623 | 12,173 | → |
| Sai Kung Islands | Constituency Area | 西貢離島 | 12,183 | 13,707 | → |
| Sheung Tak | Constituency Area | 尚德 | 19,666 | 17,063 | → |
| Tak Ming | Constituency Area | 德明 | 18,883 | 17,997 | → |
| Tsui Lam | Constituency Area | 翠林 | 15,063 | 13,588 | → |
| Wai King | Constituency Area | 維景 | 15,939 | 14,342 | → |
| Wai Yan | Constituency Area | 慧茵 | ... | 13,849 | → |
| Wan Hang | Constituency Area | 運亨 | ... | 13,898 | → |
| Wan Po North | Constituency Area | 環保北 | 17,247 | 18,682 | → |
| Wan Po South | Constituency Area | 環保南 | 19,266 | 33,452 | → |
| Yan Ying | Constituency Area | 欣英 | 18,588 | 18,481 | → |
| Hong Kong | Special Administrative Region | 香港 | 7,335,384 | 7,413,070 |
Source: Census and Statistics Department, SAR Hong Kong (web).
Explanation: Constituency areas as definied in 2019. Population figures exclude persons living on board vessels. Area figures are computed by using geospatial data.
Further information about the population structure:
| Gender (C 2021) | |
|---|---|
| Males | 223,094 |
| Females | 265,943 |
| Age Groups (C 2021) | |
|---|---|
| 0-14 years | 56,329 |
| 15-64 years | 355,435 |
| 65+ years | 77,273 |
| Age Distribution (C 2021) | |
|---|---|
| 80+ years | 17,459 |
| 70-79 years | 30,699 |
| 60-69 years | 69,075 |
| 50-59 years | 84,197 |
| 40-49 years | 80,075 |
| 30-39 years | 79,574 |
| 20-29 years | 54,181 |
| 10-19 years | 36,867 |
| 0-9 years | 36,910 |
| Ethnic Group (C 2021) | |
|---|---|
| Chinese | 442,447 |
| Filipino | 16,524 |
| Indonesian | 10,107 |
| White | 7,348 |
| Other/Mixed | 12,611 |
| Usual Language (C 2021) | |
|---|---|
| Cantonese | 413,426 |
| Mandarin | 9,625 |
| Other Chinese dialect | 10,753 |
| English | 28,502 |
| Other language | 9,299 |
