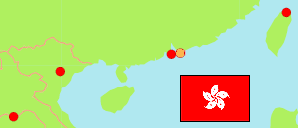
Tai Po
District Council in Hong Kong
Contents: Subdivision
The population development in Tai Po as well as related information and services (Wikipedia, Google, images).
| Name | Status | Native | Population Census 2016-06-30 | Population Census 2021-06-30 | |
|---|---|---|---|---|---|
| Tai Po | District Council | 大埔區 | 303,926 | 316,470 | |
| Chung Ting | Constituency Area | 頌汀 | 14,658 | 13,725 | → |
| Fu Heng | Constituency Area | 富亨 | 15,710 | 13,840 | → |
| Fu Ming Sun | Constituency Area | 富明新 | 13,553 | 12,628 | → |
| Hong Lok Yuen | Constituency Area | 康樂園 | ... | 20,389 | → |
| Kwong Fuk and Plover Cove | Constituency Area | 廣福及寶湖 | 13,235 | 12,752 | → |
| Lam Tsuen Valley | Constituency Area | 林村谷 | 19,369 | 20,780 | → |
| Old Market and Serenity | Constituency Area | 舊墟及太湖 | ... | 18,452 | → |
| Po Nga | Constituency Area | 寶雅 | ... | 16,763 | → |
| Sai Kung North | Constituency Area | 西貢北 | 13,023 | 15,018 | → |
| San Fu | Constituency Area | 新富 | 15,709 | 15,539 | → |
| Shuen Wan | Constituency Area | 船灣 | 19,459 | 22,465 | → |
| Tai Po Central | Constituency Area | 大埔中 | 14,055 | 13,139 | → |
| Tai Po Hui | Constituency Area | 大埔墟 | 19,893 | 18,515 | → |
| Tai Po Kau | Constituency Area | 大埔滘 | ... | 20,441 | → |
| Tai Wo | Constituency Area | 太和 | 13,727 | 12,752 | → |
| Tai Yuen | Constituency Area | 大元 | 14,568 | 13,760 | → |
| Wang Fuk | Constituency Area | 宏福 | ... | 26,893 | → |
| Wan Tau Tong | Constituency Area | 運頭塘 | 15,273 | 14,589 | → |
| Yee Fu | Constituency Area | 怡富 | 14,489 | 14,030 | → |
| Hong Kong | Special Administrative Region | 香港 | 7,335,384 | 7,413,070 |
Source: Census and Statistics Department, SAR Hong Kong (web).
Explanation: Constituency areas as definied in 2019. Population figures exclude persons living on board vessels. Area figures are computed by using geospatial data.
Further information about the population structure:
| Gender (C 2021) | |
|---|---|
| Males | 146,038 |
| Females | 170,432 |
| Age Groups (C 2021) | |
|---|---|
| 0-14 years | 34,377 |
| 15-64 years | 223,591 |
| 65+ years | 58,502 |
| Age Distribution (C 2021) | |
|---|---|
| 80+ years | 13,244 |
| 70-79 years | 21,617 |
| 60-69 years | 55,242 |
| 50-59 years | 49,160 |
| 40-49 years | 46,870 |
| 30-39 years | 52,869 |
| 20-29 years | 32,965 |
| 10-19 years | 21,492 |
| 0-9 years | 23,011 |
| Ethnic Group (C 2021) | |
|---|---|
| Chinese | 295,002 |
| Filipino | 8,241 |
| Indonesian | 6,751 |
| White | 1,807 |
| Other/Mixed | 4,669 |
| Usual Language (C 2021) | |
|---|---|
| Cantonese | 279,578 |
| Mandarin | 6,053 |
| Other Chinese dialect | 4,668 |
| English | 12,816 |
| Other language | 2,697 |