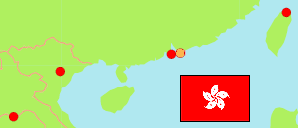
Yau Tsim Mong
District Council in Hong Kong
Contents: Subdivision
The population development in Yau Tsim Mong as well as related information and services (Wikipedia, Google, images).
| Name | Status | Native | Population Census 2016-06-30 | Population Census 2021-06-30 | |
|---|---|---|---|---|---|
| Yau Tsim Mong | District Council | 油尖旺區 | 342,970 | 310,647 | |
| Charming | Constituency Area | 富榮 | 17,198 | 16,172 | → |
| Cherry | Constituency Area | 櫻桃 | 14,109 | 14,818 | → |
| East Tsim Sha Tsui and King's Park | Constituency Area | 尖東及京士柏 | 16,080 | 14,845 | → |
| Fu Pak | Constituency Area | 富柏 | 20,235 | 18,266 | → |
| Jordan North | Constituency Area | 佐敦北 | 18,550 | 14,633 | → |
| Jordan South | Constituency Area | 佐敦南 | ... | 11,376 | → |
| Jordan West | Constituency Area | 佐敦西 | 18,260 | 15,528 | → |
| Kowloon Station | Constituency Area | 九龍站 | ... | 15,627 | → |
| Mong Kok East | Constituency Area | 旺角東 | 17,199 | 14,235 | → |
| Mong Kok North | Constituency Area | 旺角北 | 19,337 | 16,915 | → |
| Mong Kok South | Constituency Area | 旺角南 | 16,450 | 16,126 | → |
| Mong Kok West | Constituency Area | 旺角西 | 16,886 | 15,691 | → |
| Olympic | Constituency Area | 奧運 | 18,205 | 19,373 | → |
| Tai Kok Tsui North | Constituency Area | 大角咀北 | ... | 19,526 | → |
| Tai Kok Tsui South | Constituency Area | 大角咀南 | 15,790 | 14,275 | → |
| Tai Nan | Constituency Area | 大南 | ... | 19,040 | → |
| Tsim Sha Tsui Central | Constituency Area | 尖沙咀中 | ... | 13,042 | → |
| Tsim Sha Tsui West | Constituency Area | 尖沙咀西 | ... | 11,515 | → |
| Yau Ma Tei North | Constituency Area | 油麻地北 | 13,230 | 11,894 | → |
| Yau Ma Tei South | Constituency Area | 油麻地南 | 21,141 | 17,750 | → |
| Hong Kong | Special Administrative Region | 香港 | 7,335,384 | 7,413,070 |
Source: Census and Statistics Department, SAR Hong Kong (web).
Explanation: Constituency areas as definied in 2019. Population figures exclude persons living on board vessels. Area figures are computed by using geospatial data.
Further information about the population structure:
| Gender (C 2021) | |
|---|---|
| Males | 138,873 |
| Females | 171,774 |
| Age Groups (C 2021) | |
|---|---|
| 0-14 years | 36,181 |
| 15-64 years | 218,898 |
| 65+ years | 55,568 |
| Age Distribution (C 2021) | |
|---|---|
| 80+ years | 15,971 |
| 70-79 years | 22,061 |
| 60-69 years | 37,844 |
| 50-59 years | 47,369 |
| 40-49 years | 54,726 |
| 30-39 years | 53,282 |
| 20-29 years | 33,599 |
| 10-19 years | 20,984 |
| 0-9 years | 24,811 |
| Ethnic Group (C 2021) | |
|---|---|
| Chinese | 257,189 |
| Filipino | 11,980 |
| Indonesian | 7,215 |
| White | 2,902 |
| Other/Mixed | 31,361 |
| Usual Language (C 2021) | |
|---|---|
| Cantonese | 232,567 |
| Mandarin | 14,157 |
| Other Chinese dialect | 6,304 |
| English | 22,633 |
| Other language | 23,002 |