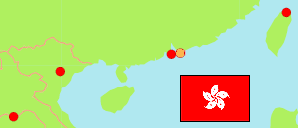
Central and Western
District Council in Hong Kong
Contents: Subdivision
The population development in Central and Western as well as related information and services (Wikipedia, Google, images).
| Name | Status | Native | Population Census 2016-06-30 | Population Census 2021-06-30 | |
|---|---|---|---|---|---|
| Central and Western | District Council | 中西區 | 243,266 | 235,953 | |
| Belcher | Constituency Area | 寶翠 | 21,151 | 20,187 | → |
| Castle Road | Constituency Area | 衛城 | 20,058 | 19,279 | → |
| Centre Street | Constituency Area | 正街 | 14,207 | 14,521 | → |
| Chung Wan | Constituency Area | 中環 | 12,501 | 11,077 | → |
| Kennedy Town and Mount Davis | Constituency Area | 堅摩 | 17,204 | 16,030 | → |
| Kwun Lung | Constituency Area | 觀龍 | 15,517 | 15,570 | → |
| Mid Levels East | Constituency Area | 半山東 | 17,009 | 15,464 | → |
| Peak | Constituency Area | 山頂 | 20,263 | 19,202 | → |
| Sai Wan | Constituency Area | 西環 | 14,517 | 14,650 | → |
| Sai Ying Pun | Constituency Area | 西營盤 | 14,418 | 13,600 | → |
| Shek Tong Tsui | Constituency Area | 石塘咀 | 17,464 | 16,125 | → |
| Sheung Wan | Constituency Area | 上環 | 13,975 | 14,830 | → |
| Tung Wah | Constituency Area | 東華 | 11,834 | 12,320 | → |
| University | Constituency Area | 大學 | 18,032 | 18,548 | → |
| Water Street | Constituency Area | 水街 | 15,116 | 14,550 | → |
| Hong Kong | Special Administrative Region | 香港 | 7,335,384 | 7,413,070 |
Source: Census and Statistics Department, SAR Hong Kong (web).
Explanation: Constituency areas as definied in 2019. Population figures exclude persons living on board vessels. Area figures are computed by using geospatial data.
Further information about the population structure:
| Gender (C 2021) | |
|---|---|
| Males | 98,282 |
| Females | 137,671 |
| Age Groups (C 2021) | |
|---|---|
| 0-14 years | 24,382 |
| 15-64 years | 166,080 |
| 65+ years | 45,491 |
| Age Distribution (C 2021) | |
|---|---|
| 80+ years | 13,673 |
| 70-79 years | 17,305 |
| 60-69 years | 30,976 |
| 50-59 years | 36,210 |
| 40-49 years | 39,168 |
| 30-39 years | 41,737 |
| 20-29 years | 25,513 |
| 10-19 years | 15,181 |
| 0-9 years | 16,190 |
| Ethnic Group (C 2021) | |
|---|---|
| Chinese | 183,502 |
| Filipino | 18,584 |
| Indonesian | 5,950 |
| White | 13,408 |
| Other/Mixed | 14,509 |
| Usual Language (C 2021) | |
|---|---|
| Cantonese | 160,608 |
| Mandarin | 12,312 |
| Other Chinese dialect | 5,545 |
| English | 41,230 |
| Other language | 8,616 |