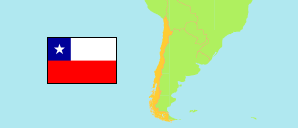
Valdivia
Province in Chile
Contents: Subdivision
The population development in Valdivia as well as related information and services (Wikipedia, Google, images).
| Name | Status | Population Estimate 2002-07-01 | Population Estimate 2007-07-01 | Population Estimate 2012-07-01 | Population Estimate 2017-07-01 | Population Projection 2023-07-01 | |
|---|---|---|---|---|---|---|---|
| Valdivia | Province | 269,017 | 278,172 | 289,839 | 300,943 | 313,064 | |
| Corral | Municipality | 5,522 | 5,436 | 5,432 | 5,436 | 5,432 | → |
| Lanco | Municipality | 15,326 | 15,997 | 16,657 | 17,264 | 17,957 | → |
| Los Lagos | Municipality | 20,810 | 20,410 | 20,379 | 20,430 | 20,523 | → |
| Máfil | Municipality | 7,409 | 7,317 | 7,334 | 7,362 | 7,381 | → |
| Mariquina | Municipality | 18,632 | 19,955 | 21,312 | 22,532 | 23,830 | → |
| Paillaco | Municipality | 19,924 | 19,942 | 20,250 | 20,575 | 20,915 | → |
| Panguipulli | Municipality | 34,543 | 34,561 | 35,077 | 35,619 | 36,178 | → |
| Valdivia | Municipality | 146,851 | 154,554 | 163,398 | 171,725 | 180,848 | → |
| Chile | Republic | 15,691,701 | 16,517,933 | 17,443,491 | 18,419,192 | 19,960,889 |
Source: Instituto Nacional de Estadísticas.
Explanation: All tabulated population figures consider the results of the 2017 census.
Further information about the population structure:
| Gender (P 2023) | |
|---|---|
| Males | 152,622 |
| Females | 160,442 |
| Age Groups (P 2023) | |
|---|---|
| 0-17 years | 68,964 |
| 18-64 years | 198,901 |
| 65+ years | 45,199 |
| Age Distribution (P 2023) | |
|---|---|
| 80+ years | 10,994 |
| 70-79 years | 19,557 |
| 60-69 years | 32,763 |
| 50-59 years | 40,781 |
| 40-49 years | 39,567 |
| 30-39 years | 46,426 |
| 20-29 years | 45,703 |
| 10-19 years | 41,670 |
| 0-9 years | 35,603 |
| Urbanization (C 2017) | |
|---|---|
| Rural | 69,339 |
| Urban | 221,529 |
| Country of Birth (C 2024) | |
|---|---|
| Chile | 293,245 |
| Bolivia | 107 |
| Colombia | 612 |
| Peru | 128 |
| Venezuela | 2,375 |
| South America (other) | 1,459 |
| Central America & Caribbean | 540 |
| North America & Europe | 569 |
| Other country & undeclared | 763 |
