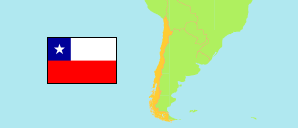
Talca
Province in Chile
Contents: Subdivision
The population development in Talca as well as related information and services (Wikipedia, Google, images).
| Name | Status | Population Estimate 2002-07-01 | Population Estimate 2007-07-01 | Population Estimate 2012-07-01 | Population Estimate 2017-07-01 | Population Projection 2023-07-01 | |
|---|---|---|---|---|---|---|---|
| Talca | Province | 367,504 | 384,452 | 406,666 | 432,215 | 462,808 | |
| Constitución | Municipality | 48,258 | 48,440 | 48,957 | 49,714 | 50,601 | → |
| Curepto | Municipality | 11,108 | 10,446 | 9,955 | 9,582 | 9,209 | → |
| Empedrado | Municipality | 4,377 | 4,276 | 4,222 | 4,200 | 4,185 | → |
| Maule | Municipality | 17,726 | 27,339 | 39,260 | 52,210 | 66,867 | → |
| Pelarco | Municipality | 7,566 | 7,908 | 8,313 | 8,766 | 9,331 | → |
| Pencahue | Municipality | 8,336 | 8,342 | 8,408 | 8,503 | 8,625 | → |
| Río Claro | Municipality | 13,063 | 13,388 | 13,822 | 14,357 | 15,042 | → |
| San Clemente | Municipality | 39,001 | 40,522 | 42,433 | 44,685 | 47,590 | → |
| San Rafael | Municipality | 7,962 | 8,422 | 8,957 | 9,554 | 10,294 | → |
| Talca | Municipality | 210,107 | 215,369 | 222,339 | 230,644 | 241,064 | → |
| Chile | Republic | 15,691,701 | 16,517,933 | 17,443,491 | 18,419,192 | 19,960,889 |
Source: Instituto Nacional de Estadísticas.
Explanation: All tabulated population figures consider the results of the 2017 census.
Further information about the population structure:
| Gender (C 2024) | |
|---|---|
| Males | 215,981 |
| Females | 229,040 |
| Age Groups (C 2024) | |
|---|---|
| 0-14 years | 81,546 |
| 15-64 years | 300,130 |
| 65+ years | 63,345 |
| Age Distribution (C 2024) | |
|---|---|
| 80+ years | 13,567 |
| 70-79 years | 28,387 |
| 60-69 years | 47,318 |
| 50-59 years | 56,074 |
| 40-49 years | 57,139 |
| 30-39 years | 67,399 |
| 20-29 years | 63,258 |
| 10-19 years | 60,744 |
| 0-9 years | 51,135 |
| Urbanization (C 2024) | |
|---|---|
| Rural | 92,493 |
| Urban | 352,528 |
| Country of Birth (C 2024) | |
|---|---|
| Chile | 423,486 |
| Bolivia | 438 |
| Colombia | 1,719 |
| Peru | 718 |
| Venezuela | 13,708 |
| South America (other) | 1,508 |
| Central America & Caribbean | 1,971 |
| North America & Europe | 411 |
| Other country & undeclared | 1,062 |
| Ethnic Group (C 2024) | |
|---|---|
| Non-indigenous People | 428,606 |
| Indigenous People | 16,391 |
| Religion (A15+) (C 2024) | |
|---|---|
| Catholics | 222,678 |
| Evangelicals or Protestants | 58,599 |
| Other Religion | 9,903 |
| No Religion | 70,748 |