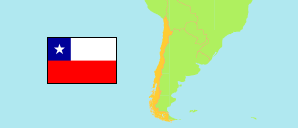
Cachapoal
Province in Chile
Contents: Subdivision
The population development in Cachapoal as well as related information and services (Wikipedia, Google, images).
| Name | Status | Population Estimate 2002-07-01 | Population Estimate 2007-07-01 | Population Estimate 2012-07-01 | Population Estimate 2017-07-01 | Population Projection 2023-07-01 | |
|---|---|---|---|---|---|---|---|
| Cachapoal | Province | 562,376 | 597,027 | 636,396 | 676,775 | 725,440 | |
| Codegua | Municipality | 11,071 | 11,952 | 12,751 | 13,545 | 14,504 | → |
| Coinco | Municipality | 6,625 | 6,917 | 7,253 | 7,592 | 7,983 | → |
| Coltauco | Municipality | 16,892 | 17,966 | 19,152 | 20,387 | 21,936 | → |
| Doñihue | Municipality | 17,674 | 19,037 | 20,397 | 21,755 | 23,425 | → |
| Graneros | Municipality | 26,791 | 29,613 | 32,293 | 34,828 | 37,793 | → |
| Las Cabras | Municipality | 20,887 | 22,641 | 24,189 | 25,703 | 27,520 | → |
| Machalí | Municipality | 29,942 | 38,802 | 47,358 | 55,258 | 63,642 | → |
| Malloa | Municipality | 13,371 | 13,453 | 13,660 | 13,916 | 14,274 | → |
| Mostazal | Municipality | 22,139 | 23,480 | 24,883 | 26,378 | 28,295 | → |
| Olivar | Municipality | 12,676 | 13,157 | 13,647 | 14,194 | 14,919 | → |
| Peumo | Municipality | 14,424 | 14,423 | 14,555 | 14,742 | 15,018 | → |
| Pichidegua | Municipality | 18,314 | 18,895 | 19,574 | 20,246 | 21,009 | → |
| Quinta de Tilcoco | Municipality | 11,788 | 12,253 | 12,820 | 13,425 | 14,194 | → |
| Rancagua | Municipality | 222,553 | 230,381 | 242,327 | 255,550 | 272,290 | → |
| Rengo | Municipality | 52,595 | 55,204 | 58,252 | 61,438 | 65,318 | → |
| Requínoa | Municipality | 22,876 | 25,020 | 27,026 | 29,017 | 31,410 | → |
| San Vicente (San Vicente de Tagua Tagua) | Municipality | 41,758 | 43,833 | 46,259 | 48,801 | 51,910 | → |
| Chile | Republic | 15,691,701 | 16,517,933 | 17,443,491 | 18,419,192 | 19,960,889 |
Source: Instituto Nacional de Estadísticas.
Explanation: All tabulated population figures consider the results of the 2017 census.
Further information about the population structure:
| Gender (C 2024) | |
|---|---|
| Males | 339,451 |
| Females | 353,857 |
| Age Groups (C 2024) | |
|---|---|
| 0-14 years | 126,871 |
| 15-64 years | 466,832 |
| 65+ years | 99,605 |
| Age Distribution (C 2024) | |
|---|---|
| 80+ years | 20,967 |
| 70-79 years | 44,587 |
| 60-69 years | 75,776 |
| 50-59 years | 88,143 |
| 40-49 years | 91,542 |
| 30-39 years | 106,566 |
| 20-29 years | 92,747 |
| 10-19 years | 95,527 |
| 0-9 years | 77,453 |
| Urbanization (C 2024) | |
|---|---|
| Rural | 146,160 |
| Urban | 547,148 |
| Country of Birth (C 2024) | |
|---|---|
| Chile | 655,784 |
| Bolivia | 4,287 |
| Colombia | 3,528 |
| Peru | 1,388 |
| Venezuela | 19,082 |
| South America (other) | 3,121 |
| Central America & Caribbean | 3,489 |
| North America & Europe | 401 |
| Other country & undeclared | 2,228 |
| Ethnic Group (C 2024) | |
|---|---|
| Non-indigenous People | 654,994 |
| Indigenous People | 38,242 |
| Religion (A15+) (C 2024) | |
|---|---|
| Catholics | 342,082 |
| Evangelicals or Protestants | 80,068 |
| Other Religion | 17,783 |
| No Religion | 124,377 |