Venezuela
Bolivarian Republic of Venezuela
National
-

News
The total mid-2019 population is projected to be 32.2 million. This number is adjusted for census underenumeration. However, it does not consider emigration caused by the current economical and political situation in Venezuela.
2019-05-11
Ethnic groups according to 2011 census are added to states and municipalities. In respect to the total population of Venezuela, 50.3% are mestizos, 42.5% white, 3.5% Afro-Venezuelan and 2.7% indigenous.
2019-05-10
-
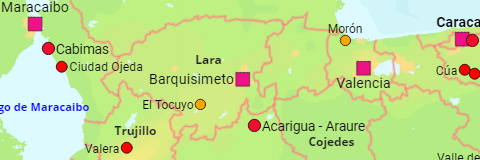
States & Major Cities
The states of Venezuela as well as all cities and towns with more than 20,000 inhabitants.
1981, 1990, 2001, 2011 census, 2019 projection
-
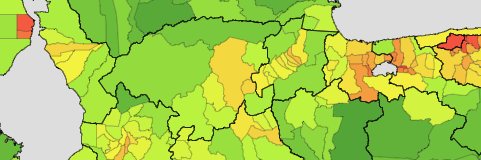
Administrative Division
The population of the states and municipalities of Venezuela.
2001, 2011 estimation, 2019 projection
-

States
- Municipalities: the municipalities of the state – 2001, 2011 estimation, 2019 projection
- Urban Localities: all urban localities in the state – 2000, 2011 census
-
Amazonas
-
Anzoátegui
-
Aragua
-
Barinas
-
Bolívar
-
Carabobo
-
Cojedes
-
Delta Amacuro
-
Dependencias Federales
-
Distrito Capital
-
Falcón
-
Guárico
-
Mérida
-
Miranda
-
Monagas
-
Nueva Esparta
-
Portuguesa
-
Táchira
-
Trujillo
-
Vargas
-
Yaracuy