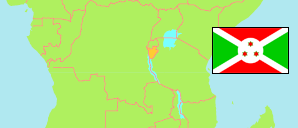
Gitega
Commune in Burundi
Contents: Population
The population development of Gitega as well as related information and services (Wikipedia, Google, images).
| Name | Status | Population Census 2008-08-16 | Population Census 2024-08-16 | |
|---|---|---|---|---|
| Gitega | Commune | 338,617 | 528,528 | |
| Burundi | Republic | 8,053,574 | 12,332,788 |
Source: L'Institut de Statistiques et d’Etudes Economiques du Burundi
Explanation: Provinces and communes according to the territorial reform of 2023. The results of the 2024 census are preliminary. Area figures are calculated using geospatial data.
Further information about the population structure:
| Gender (C 2024) | |
|---|---|
| Males | 244,171 |
| Females | 284,357 |
| Urbanization (C 2024) | |
|---|---|
| Rural | 302,142 |
| Urban | 212,680 |