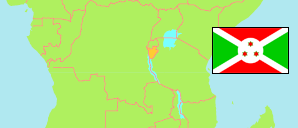
Gitega
Province in Burundi
Contents: Subdivision
The population development in Gitega as well as related information and services (Wikipedia, Google, images).
| Name | Status | Population Census 2008-08-16 | Population Census 2024-08-16 | |
|---|---|---|---|---|
| Gitega | Province | 1,660,155 | 2,278,215 | |
| Bugendana | Commune | 173,741 | 229,652 | → |
| Gishubi | Commune | 199,568 | 243,533 | → |
| Gitega | Commune | 338,617 | 528,528 | → |
| Karusi | Commune | 254,753 | 377,638 | → |
| Kiganda | Commune | 117,995 | 149,522 | → |
| Muramvya | Commune | 120,648 | 171,010 | → |
| Mwaro | Commune | 124,212 | 149,190 | → |
| Nyabihanga | Commune | 148,931 | 175,208 | → |
| Shombo | Commune | 181,690 | 253,934 | → |
| Burundi | Republic | 8,053,574 | 12,332,788 |
Source: L'Institut de Statistiques et d’Etudes Economiques du Burundi
Explanation: Provinces and communes according to the territorial reform of 2023. The results of the 2024 census are preliminary. Area figures are calculated using geospatial data.