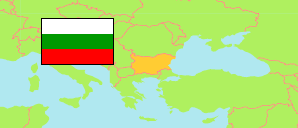
Smoljan
Province in Bulgaria
Contents: Subdivision
The population development in Smoljan as well as related information and services (Wikipedia, Google, images).
| Name | Status | Native | Population Census 2001-03-01 | Population Census 2011-02-01 | Population Census 2021-09-07 | Population Estimate 2024-12-31 | |
|---|---|---|---|---|---|---|---|
| Smoljan [Smolyan] | Province | Смолян | 140,066 | 121,752 | 96,284 | 90,534 | |
| Banite | Municipality | Баните | 6,765 | 4,923 | 3,302 | 2,957 | → |
| Borino | Municipality | Борино | 4,109 | 3,641 | 2,493 | 2,376 | → |
| Čepelare [Chepelare] | Municipality | Чепеларе | 9,232 | 7,720 | 5,943 | 5,615 | → |
| Devin | Municipality | Девин | 15,010 | 13,013 | 9,765 | 9,101 | → |
| Dospat | Municipality | Доспат | 10,276 | 9,116 | 7,510 | 6,995 | → |
| Madan | Municipality | Мадан | 13,812 | 12,276 | 10,062 | 9,479 | → |
| Nedelino | Municipality | Неделино | 8,715 | 7,221 | 5,079 | 4,691 | → |
| Rudozem | Municipality | Рудозем | 10,875 | 10,069 | 8,674 | 8,222 | → |
| Smoljan [Smolyan] | Municipality | Смолян | 47,230 | 41,452 | 33,688 | 31,910 | → |
| Zlatograd | Municipality | Златоград | 14,042 | 12,321 | 9,768 | 9,188 | → |
| Bǎlgarija [Bulgaria] | Republic | България | 7,932,984 | 7,364,570 | 6,519,789 | 6,437,360 |
Source: National Statistical Institute Bulgaria.
Further information about the population structure:
| Gender (E 2024) | |
|---|---|
| Males | 43,281 |
| Females | 47,253 |
| Age Groups (C 2021) | |
|---|---|
| 0-14 years | 10,637 |
| 15-64 years | 60,116 |
| 65+ years | 25,531 |
| Age Distribution (C 2021) | |
|---|---|
| 80+ years | 5,146 |
| 70-79 years | 11,816 |
| 60-69 years | 17,997 |
| 50-59 years | 15,784 |
| 40-49 years | 13,466 |
| 30-39 years | 10,969 |
| 20-29 years | 6,646 |
| 10-19 years | 8,048 |
| 0-9 years | 6,412 |
| Urbanization (E 2024) | |
|---|---|
| Rural | 38,454 |
| Urban | 52,080 |
| Ethnic Group (C 2021) | |
|---|---|
| Bulgarians | 86,818 |
| Turks | 3,049 |
| Roma | 483 |
| other / indefinable | 3,825 |
| Mother Tongue (C 2021) | |
|---|---|
| Bulgarian | 90,526 |
| Turkish | 3,373 |
| Roma | 443 |
| other / indefinable | 406 |
| Religion (C 2021) | |
|---|---|
| Christians | 23,079 |
| Muslims | 39,217 |
| Other Religion | 68 |
| No Religion | 6,519 |
