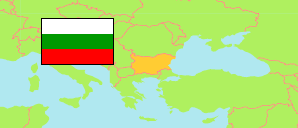
Plovdiv
Province in Bulgaria
Contents: Subdivision
The population development in Plovdiv as well as related information and services (Wikipedia, Google, images).
| Name | Status | Native | Population Census 2001-03-01 | Population Census 2011-02-01 | Population Census 2021-09-07 | Population Estimate 2024-12-31 | |
|---|---|---|---|---|---|---|---|
| Plovdiv | Province | Пловдив | 715,904 | 683,027 | 634,497 | 635,630 | |
| Asenovgrad | Municipality | Асеновград | 67,238 | 64,034 | 57,601 | 56,859 | → |
| Brezovo | Municipality | Брезово | 8,837 | 7,298 | 6,170 | 5,877 | → |
| Hisarja [Hisar] | Municipality | Хисаря | 15,666 | 12,600 | 10,592 | 9,952 | → |
| Kalojanovo [Kaloyanovo] | Municipality | Калояново | 13,649 | 11,879 | 10,598 | 10,231 | → |
| Karlovo | Municipality | Карлово | 59,298 | 52,307 | 46,784 | 44,894 | → |
| Kričim [Krichim] | Municipality | Кричим | 8,535 | 8,409 | 7,245 | 7,128 | → |
| Kuklen | Municipality | Куклен | 6,556 | 6,431 | 6,276 | 6,134 | → |
| Lǎki [Laki] | Municipality | Лъки | 4,044 | 2,902 | 2,220 | 2,043 | → |
| Marica | Municipality | Марица | 32,333 | 32,438 | 32,154 | 31,191 | → |
| Pǎrvomaj [Parvomay] | Municipality | Първомай | 31,160 | 25,883 | 21,807 | 20,757 | → |
| Peruštica [Perushtitsa] | Municipality | Перущица | 5,387 | 5,058 | 4,298 | 4,148 | → |
| Plovdiv | Municipality | Пловдив | 338,302 | 338,153 | 319,612 | 329,489 | → |
| Rakovski | Municipality | Раковски | 28,383 | 26,381 | 25,893 | 25,389 | → |
| Rodopi | Municipality | Родопи | 34,259 | 32,602 | 32,689 | 32,359 | → |
| Sadovo | Municipality | Садово | 16,786 | 15,604 | 14,766 | 14,528 | → |
| Sǎedinenie [Saedinenie] | Municipality | Съединение | 12,182 | 10,450 | 9,310 | 8,858 | → |
| Sopot | Municipality | Сопот | 10,986 | 9,827 | 8,375 | 8,139 | → |
| Stambolijski [Stamboliyski] | Municipality | Стамболийски | 22,303 | 20,771 | 18,107 | 17,654 | → |
| Bǎlgarija [Bulgaria] | Republic | България | 7,932,984 | 7,364,570 | 6,519,789 | 6,437,360 |
Source: National Statistical Institute Bulgaria.
Further information about the population structure:
| Gender (E 2024) | |
|---|---|
| Males | 303,208 |
| Females | 332,422 |
| Age Groups (C 2021) | |
|---|---|
| 0-14 years | 92,543 |
| 15-64 years | 399,794 |
| 65+ years | 142,160 |
| Age Distribution (C 2021) | |
|---|---|
| 80+ years | 34,338 |
| 70-79 years | 66,749 |
| 60-69 years | 86,033 |
| 50-59 years | 87,868 |
| 40-49 years | 94,940 |
| 30-39 years | 85,027 |
| 20-29 years | 59,526 |
| 10-19 years | 59,302 |
| 0-9 years | 60,714 |
| Urbanization (E 2024) | |
|---|---|
| Rural | 160,165 |
| Urban | 475,465 |
| Ethnic Group (C 2021) | |
|---|---|
| Bulgarians | 513,249 |
| Turks | 39,585 |
| Roma | 26,296 |
| other / indefinable | 6,224 |
| Mother Tongue (C 2021) | |
|---|---|
| Bulgarian | 498,281 |
| Turkish | 39,581 |
| Roma | 26,113 |
| other / indefinable | 6,145 |
| Religion (C 2021) | |
|---|---|
| Christians | 439,779 |
| Muslims | 39,851 |
| Other Religion | 678 |
| No Religion | 21,980 |