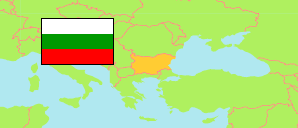
Blagoevgrad
Province in Bulgaria
Contents: Subdivision
The population development in Blagoevgrad as well as related information and services (Wikipedia, Google, images).
| Name | Status | Native | Population Census 2001-03-01 | Population Census 2011-02-01 | Population Census 2021-09-07 | Population Estimate 2024-12-31 | |
|---|---|---|---|---|---|---|---|
| Blagoevgrad | Province | Благоевград | 341,244 | 323,552 | 292,227 | 286,333 | |
| Bansko | Municipality | Банско | 13,980 | 13,125 | 12,722 | 13,525 | → |
| Belica [Belitsa] | Municipality | Белица | 9,620 | 9,927 | 9,206 | 8,923 | → |
| Blagoevgrad | Municipality | Благоевград | 78,175 | 77,441 | 69,078 | 69,265 | → |
| Gǎrmen [Garmen] | Municipality | Гърмен | 14,934 | 14,981 | 14,861 | 14,806 | → |
| Goce Delčev [Gotse Delchev] | Municipality | Гоце Делчев | 32,571 | 31,236 | 29,383 | 28,714 | → |
| Hadžidimovo [Hadzhidimovo] | Municipality | Хаджидимово | 10,926 | 10,091 | 8,860 | 8,388 | → |
| Jakoruda [Yakoruda] | Municipality | Якоруда | 11,109 | 10,731 | 9,581 | 9,155 | → |
| Kresna | Municipality | Кресна | 6,255 | 5,441 | 4,546 | 4,258 | → |
| Petrič [Petrich] | Municipality | Петрич | 57,717 | 54,006 | 47,939 | 46,343 | → |
| Razlog | Municipality | Разлог | 22,081 | 20,598 | 18,910 | 18,395 | → |
| Sandanski | Municipality | Сандански | 43,109 | 40,470 | 35,885 | 34,716 | → |
| Satovča [Satovcha] | Municipality | Сатовча | 17,889 | 15,444 | 13,422 | 12,765 | → |
| Simitli | Municipality | Симитли | 16,049 | 14,283 | 13,200 | 12,651 | → |
| Strumjani [Strumyani] | Municipality | Струмяни | 6,829 | 5,778 | 4,634 | 4,429 | → |
| Bǎlgarija [Bulgaria] | Republic | България | 7,932,984 | 7,364,570 | 6,519,789 | 6,437,360 |
Source: National Statistical Institute Bulgaria.
Further information about the population structure:
| Gender (E 2024) | |
|---|---|
| Males | 138,888 |
| Females | 147,445 |
| Age Groups (C 2021) | |
|---|---|
| 0-14 years | 42,594 |
| 15-64 years | 187,711 |
| 65+ years | 61,922 |
| Age Distribution (C 2021) | |
|---|---|
| 80+ years | 13,414 |
| 70-79 years | 28,400 |
| 60-69 years | 42,496 |
| 50-59 years | 43,948 |
| 40-49 years | 41,856 |
| 30-39 years | 39,041 |
| 20-29 years | 26,377 |
| 10-19 years | 29,417 |
| 0-9 years | 27,278 |
| Urbanization (E 2024) | |
|---|---|
| Rural | 113,887 |
| Urban | 172,446 |
| Ethnic Group (C 2021) | |
|---|---|
| Bulgarians | 236,951 |
| Turks | 14,028 |
| Roma | 12,318 |
| other / indefinable | 12,407 |
| Mother Tongue (C 2021) | |
|---|---|
| Bulgarian | 254,268 |
| Turkish | 5,252 |
| Roma | 8,620 |
| other / indefinable | 2,344 |
| Religion (C 2021) | |
|---|---|
| Christians | 196,841 |
| Muslims | 52,958 |
| Other Religion | 173 |
| No Religion | 3,925 |
