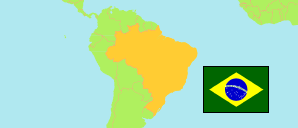
Roraima
State in North Region
Contents: Subdivision
The population development in Roraima as well as related information and services (Wikipedia, Google, images).
| Name | Status | Population Census 1991-09-01 | Population Census 2000-08-01 | Population Census 2010-08-01 | Population Census 2022-08-01 | Population Estimate 2025-07-01 | |
|---|---|---|---|---|---|---|---|
| Roraima | State | 217,583 | 324,397 | 450,479 | 636,707 | 738,772 | |
| Alto Alegre | Municipality | 11,211 | 17,907 | 16,448 | 21,096 | 23,589 | → |
| Amajari | Municipality | 4,029 | 5,294 | 9,327 | 13,927 | 16,112 | → |
| Boa Vista | Municipality | 134,155 | 200,568 | 284,313 | 413,486 | 485,477 | → |
| Bonfim | Municipality | 4,058 | 9,326 | 10,943 | 13,923 | 15,570 | → |
| Cantá | Municipality | 5,520 | 8,571 | 13,902 | 18,682 | 21,102 | → |
| Caracaraí | Municipality | 8,764 | 14,286 | 18,398 | 20,957 | 22,750 | → |
| Caroebe | Municipality | 5,409 | 5,692 | 8,114 | 10,656 | 12,004 | → |
| Iracema | Municipality | 2,739 | 4,781 | 8,696 | 10,023 | 10,937 | → |
| Mucajaí | Municipality | 10,605 | 11,247 | 14,792 | 18,095 | 20,006 | → |
| Normandia | Municipality | 7,419 | 6,138 | 8,940 | 13,986 | 16,323 | → |
| Pacaraima | Municipality | 5,035 | 6,990 | 10,433 | 19,305 | 23,112 | → |
| Rorainópolis | Municipality | 5,865 | 17,393 | 24,279 | 32,647 | 37,787 | → |
| São João da Baliza | Municipality | 4,546 | 5,091 | 6,769 | 8,858 | 9,969 | → |
| São Luiz | Municipality | 3,429 | 5,311 | 6,750 | 7,315 | 7,848 | → |
| Uiramutã | Municipality | 4,799 | 5,802 | 8,375 | 13,751 | 16,186 | → |
| Região Norte [North] | Region | 10,030,556 | 12,900,704 | 15,864,454 | 17,354,884 | 18,801,282 |
Source: Instituto Brasileiro de Geografia e Estatistica.
Explanation: The population estimates for 2025 are based on adjusted results of the 2010 and 2022 census. Some population changes are due to changes in boundaries.
Further information about the population structure:
| Gender (C 2022) | |
|---|---|
| Males | 320,392 |
| Females | 316,315 |
| Age Groups (C 2022) | |
|---|---|
| 0-14 years | 186,208 |
| 15-64 years | 418,124 |
| 65+ years | 32,375 |
| Age Distribution (C 2022) | |
|---|---|
| 90+ years | 843 |
| 80-89 years | 4,371 |
| 70-79 years | 13,779 |
| 60-69 years | 31,467 |
| 50-59 years | 51,855 |
| 40-49 years | 78,224 |
| 30-39 years | 98,674 |
| 20-29 years | 114,411 |
| 10-19 years | 115,088 |
| 0-9 years | 127,995 |
| Urbanization (C 2022) | |
|---|---|
| Rural | 138,937 |
| Urban | 497,770 |
| Ethnic Group (C 2022) | |
|---|---|
| Indigenous | 97,668 |
| Non-Indigenous | 539,039 |
| Color (C 2022) | |
|---|---|
| Black | 49,195 |
| White | 131,260 |
| Mixed / Other | 455,160 |
| Literacy (A15+) (C 2022) | |
|---|---|
| yes | 419,303 |
| no | 31,196 |