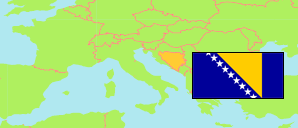
Kiseljak
in Kiseljak (Central Bosnia Canton)
Contents: Urban Settlement
The population development of Kiseljak as well as related information and services (weather, Wikipedia, Google, images).
| Name | Municipality | Population Census 1991-03-31 | Population Census 2013-10-01 | |
|---|---|---|---|---|
| Kiseljak | Kiseljak | 3,412 | 3,554 | → |
Source: Bosnia and Herzegovina Agency for Statistics (web).
Further information about the population structure:
| Gender (C 2013) | |
|---|---|
| Males | 1,654 |
| Females | 1,900 |
| Age Groups (C 2013) | |
|---|---|
| 0-14 years | 546 |
| 15-64 years | 2,546 |
| 65+ years | 462 |
| Age Distribution (C 2013) | |
|---|---|
| 0-9 years | 356 |
| 10-19 years | 429 |
| 20-29 years | 504 |
| 30-39 years | 540 |
| 40-49 years | 465 |
| 50-59 years | 563 |
| 60-69 years | 371 |
| 70-79 years | 258 |
| 80+ years | 68 |
| Ethnic Group (C 2013) | |
|---|---|
| Bosniaks | 477 |
| Serbs | 115 |
| Croats | 2,853 |
| Other group | 71 |