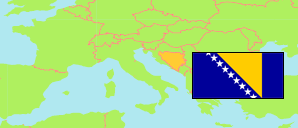
Sapna
Municipality in Bosnia and Herzegovina
Contents: Population
The population development of Sapna as well as related information and services (Wikipedia, Google, images).
| Name | Status | Population Census 1991-03-31 | Population Census 2013-10-01 | Population Estimate 2022-06-30 | |
|---|---|---|---|---|---|
| Sapna | Municipality | 13,500 | 11,178 | 10,307 | |
| Bosna i Hercegovina (Босна и Херцеговина) [Bosnia and Herzegovina] | Country | 4,377,033 | 3,473,078 | 3,358,744 |
Source: Federal Office of Statistics of the Federation of Bosnia & Herzegovina, Republika Srpska Institute of Statistics, Bosnia and Herzegovina Agency for Statistics.
Explanation: The tabulated population figures of 2013 include citizens of Bosnia and Herzegovina living and working abroad for many years. The Republika Srpska Institute of Statistics reports usually resident population figures that are about 5% less.
Further information about the population structure:
| Gender (E 2019) | |
|---|---|
| Males | 5,471 |
| Females | 5,169 |
| Age Groups (C 2013) | |
|---|---|
| 0-14 years | 2,102 |
| 15-64 years | 8,097 |
| 65+ years | 979 |
| Age Distribution (C 2013) | |
|---|---|
| 0-9 years | 1,380 |
| 10-19 years | 1,783 |
| 20-29 years | 1,733 |
| 30-39 years | 1,726 |
| 40-49 years | 1,714 |
| 50-59 years | 1,351 |
| 60-69 years | 821 |
| 70-79 years | 511 |
| 80+ years | 159 |
| Ethnic Group (C 2013) | |
|---|---|
| Bosniaks | 10,827 |
| Serbs | 234 |
| Croats | 3 |
| Other group | 93 |
| Religion (C 2013) | |
|---|---|
| Muslim | 10,912 |
| Orthodox | 236 |
| Catholic | 9 |
| Other religion | 3 |