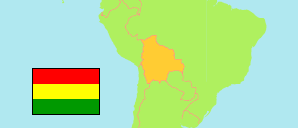
La Paz
Department in Bolivia
Contents: Subdivision
The population development in La Paz as well as related information and services (Wikipedia, Google, images).
| Name | Status | Population Census 1992-06-03 | Population Census 2001-06-29 | Population Census 2012-11-21 | Population Census 2024-03-23 | |
|---|---|---|---|---|---|---|
| La Paz | Department | 1,900,786 | 2,349,885 | 2,719,344 | 3,030,917 | |
| Abel Iturralde | Province | 8,226 | 11,828 | 18,073 | 22,700 | → |
| Aroma | Province | 65,730 | 86,480 | 98,205 | 112,736 | → |
| Bautista Saavedra | Province | 9,995 | 11,374 | 16,308 | 22,374 | → |
| Camacho (Eliodoro Camacho) | Province | 53,487 | 57,877 | 54,072 | 63,654 | → |
| Caranavi | Province | 43,093 | 51,153 | 61,524 | 70,261 | → |
| Franz Tamayo | Province | 17,619 | 18,386 | 27,088 | 28,216 | → |
| General José Manuel Pando (José Manuel Pando) | Province | 4,577 | 6,137 | 7,474 | 12,156 | → |
| Gualberto Villarroel | Province | 11,685 | 15,722 | 17,865 | 17,918 | → |
| Ingavi | Province | 78,059 | 95,906 | 134,965 | 176,183 | → |
| Inquisivi | Province | 57,345 | 59,167 | 66,462 | 86,065 | → |
| Larecaja | Province | 68,762 | 68,063 | 86,122 | 106,921 | → |
| Loayza | Province | 35,809 | 43,731 | 47,473 | 58,391 | → |
| Los Andes | Province | 62,185 | 69,636 | 78,579 | 117,009 | → |
| Manco Kapac | Province | 20,554 | 22,892 | 27,244 | 34,152 | → |
| Muñecas | Province | 17,820 | 25,132 | 25,378 | 33,580 | → |
| Murillo (Pedro Domingo Murillo) | Province | 1,156,423 | 1,484,328 | 1,669,807 | 1,731,619 | → |
| Nor Yungas | Province | 20,433 | 23,681 | 36,327 | 51,241 | → |
| Omasuyos | Province | 73,703 | 85,570 | 84,634 | 94,520 | → |
| Pacajes | Province | 43,351 | 49,183 | 55,316 | 69,300 | → |
| Sud Yungas | Province | 51,930 | 63,639 | 106,428 | 121,921 | → |
| Bolivia | Plurinational State | 6,420,792 | 8,274,325 | 10,059,856 | 11,365,333 |
Source: Instituto Nacional de Estadística de Bolivia.
Explanation: Census figures are not adjusted for undercount. Area figures of provinces are calculated using geospatial data.
Further information about the population structure:
| Gender (C 2024) | |
|---|---|
| Males | 1,504,480 |
| Females | 1,526,437 |
| Age Groups (C 2024) | |
|---|---|
| 0-14 years | 747,954 |
| 15-64 years | 2,028,658 |
| 65+ years | 254,305 |
| Age Distribution (C 2024) | |
|---|---|
| 90+ years | 7,715 |
| 80-89 years | 42,393 |
| 70-79 years | 116,499 |
| 60-69 years | 202,250 |
| 50-59 years | 278,005 |
| 40-49 years | 379,533 |
| 30-39 years | 462,192 |
| 20-29 years | 536,503 |
| 10-19 years | 535,910 |
| 0-9 years | 469,917 |
| Urbanization (C 2024) | |
|---|---|
| Rural | 1,066,618 |
| Urban | 1,964,299 |
| Main Language (C 2024) | |
|---|---|
| Spanish | 2,381,428 |
| Quechua | 43,080 |
| Aymara | 502,388 |
| Guaraní | 90 |
| German | 1,135 |
| Other Language | 36,516 |
| Identification (C 2024) | |
|---|---|
| Quechua | 76,005 |
| Aymara | 1,310,994 |
| Guaraní | 1,348 |
| Chiquitano | 218 |
| Other Indigenous Group | 113,584 |
| Campesino | 100,311 |
| Afro-Bolivian | 11,590 |
| not applicable | 1,396,507 |