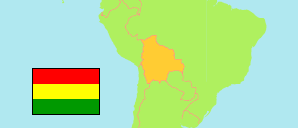
Morochata
Municipality in Bolivia
Contents: Population
The population development of Morochata as well as related information and services (Wikipedia, Google, images).
| Name | Status | Population Census 2001-06-29 | Population Census 2012-11-21 | Population Census 2024-03-23 | |
|---|---|---|---|---|---|
| Morochata | Municipality | 17,073 | 12,797 | 14,720 | |
| Bolivia | Plurinational State | 8,274,325 | 10,059,856 | 11,365,333 |
Source: Instituto Nacional de Estadística de Bolivia.
Explanation: Census figures are not adjusted for undercount. Area figures of municipalities are calculated using geospatial data.
Further information about the population structure:
| Gender (C 2024) | |
|---|---|
| Males | 7,552 |
| Females | 7,168 |
| Age Groups (C 2024) | |
|---|---|
| 0-14 years | 4,188 |
| 15-64 years | 8,842 |
| 65+ years | 1,690 |
| Age Distribution (C 2024) | |
|---|---|
| 90+ years | 84 |
| 80-89 years | 321 |
| 70-79 years | 707 |
| 60-69 years | 1,240 |
| 50-59 years | 1,394 |
| 40-49 years | 1,712 |
| 30-39 years | 1,694 |
| 20-29 years | 2,143 |
| 10-19 years | 2,808 |
| 0-9 years | 2,617 |
| Urbanization (C 2024) | |
|---|---|
| Rural | 14,720 |
| Main Language (C 2024) | |
|---|---|
| Spanish | 2,264 |
| Quechua | 11,901 |
| Aymara | 11 |
| Other Language | 197 |
| Identification (C 2024) | |
|---|---|
| Quechua | 11,289 |
| Aymara | 18 |
| Other Indigenous Group | 71 |
| Campesino | 1,086 |
| Afro-Bolivian | 6 |
| not applicable | 2,050 |