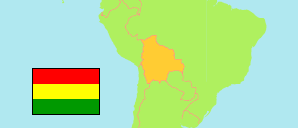
San Borja
Municipality in Bolivia
Contents: Population
The population development of San Borja as well as related information and services (Wikipedia, Google, images).
| Name | Status | Population Projection 2012-07-01 | Population Projection 2020-07-01 | |
|---|---|---|---|---|
| San Borja | Municipality | 41,852 | 44,657 | |
| Bolivia | Plurinational State | 10,351,118 | 11,633,371 |
Source: Instituto Nacional de Estadística de Bolivia (web).
Further information about the population structure:
| Gender (C 2012) | |
|---|---|
| Males | 21,072 |
| Females | 19,792 |
| Age Groups (C 2012) | |
|---|---|
| 0-14 years | 16,402 |
| 15-64 years | 22,561 |
| 65+ years | 1,901 |
| Age Distribution (C 2012) | |
|---|---|
| 0-9 years | 11,145 |
| 10-19 years | 10,143 |
| 20-29 years | 5,905 |
| 30-39 years | 4,876 |
| 40-49 years | 3,712 |
| 50-59 years | 2,258 |
| 60-69 years | 1,529 |
| 70-79 years | 844 |
| 80+ years | 452 |
| Urbanization (C 2012) | |
|---|---|
| Rural | 18,678 |
| Urban | 22,186 |
| Literacy (A15+) (C 2012) | |
|---|---|
| yes | 22,407 |
| no | 2,055 |