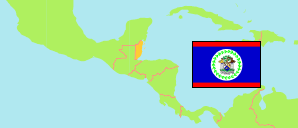
Orange Walk
District in Belize
Contents: Population
The population development in Orange Walk as well as related information and services (Wikipedia, Google, images).
| Name | Status | Population Census 2000-05-12 | Population Census 2010-05-12 | Population Census 2022-05-12 | Population Estimate 2025-07-01 | |
|---|---|---|---|---|---|---|
| Orange Walk | District | 40,132 | 45,946 | 54,152 | 56,356 | |
| Belize | Country | 248,916 | 324,528 | 397,483 | 417,634 |
Source: Statistical Institute of Belize.
Further information about the population structure:
| Gender (E 2025) | |
|---|---|
| Males | 27,645 |
| Females | 28,428 |
| Age Groups (C 2022) | |
|---|---|
| 0-14 years | 16,024 |
| 15-64 years | 34,966 |
| 65+ years | 3,162 |
| Age Distribution (C 2022) | |
|---|---|
| 0-9 years | 10,342 |
| 10-19 years | 11,102 |
| 20-29 years | 8,761 |
| 30-39 years | 8,257 |
| 40-49 years | 6,050 |
| 50-59 years | 4,739 |
| 60-69 years | 2,926 |
| 70-79 years | 1,395 |
| 80+ years | 580 |
| Urbanization (E 2025) | |
|---|---|
| Rural | 41,576 |
| Urban | 14,780 |
| Ethnic Group (C 2022) | |
|---|---|
| Mestizo/Hispanic/Latino | 43,236 |
| Creole | 3,412 |
| Maya | 401 |
| Garifuna | 311 |
| Mennonite/Caucasian/White | 5,921 |
| Asian | 383 |
| Other Group | 231 |
| Religion (C 2022) | |
|---|---|
| Roman Catholics | 20,182 |
| Pentecostals | 4,068 |
| Seventh-day Adventists | 2,171 |
| Anglicans | 1,072 |
| Mennonites | 5,350 |
| Baptists | 466 |
| Other religion | 7,395 |
| No religion | 13,111 |