
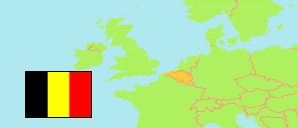
Tielt
Arrondissement in West-Vlaanderen
Arrondissement
The population development of Tielt.
| Name | Status | Population Census 1970-12-31 | Population Census 1981-03-01 | Population Census 1991-03-01 | Population Estimate 2001-01-01 | Population Census 2011-01-01 | Population Estimate 2016-01-01 | Population Census 2021-01-01 | Population Estimate 2026-01-01 | |
|---|---|---|---|---|---|---|---|---|---|---|
| Tielt | Arrondissement | 83,645 | 84,727 | 86,045 | 88,034 | 90,274 | 92,124 | 93,726 | 96,519 | → |
| West-Vlaanderen [West Flanders] | Province | 1,054,431 | 1,079,253 | 1,106,829 | 1,130,040 | 1,164,967 | 1,181,828 | 1,203,312 | 1,235,671 |
Contents: Cities and Municipalities
The population development of the cities and municipalities in Tielt.
 icon links to further information about a selected place including its population structure (gender, age groups, age distribution, citizenship).
| Name | Status | Arrondissement | Population Census 1970-12-31 | Population Census 1981-03-01 | Population Census 1991-03-01 | Population Estimate 2001-01-01 | Population Census 2011-01-01 | Population Estimate 2016-01-01 | Population Census 2021-01-01 | Population Estimate 2026-01-01 | |
|---|---|---|---|---|---|---|---|---|---|---|---|
| Ardooie | Municipality | Tielt | 9,239 | 9,458 | 9,672 | 9,396 | 9,059 | 9,053 | 9,151 | 9,546 | → |
| Dentergem | Municipality | Tielt | 7,006 | 7,304 | 7,559 | 7,931 | 8,311 | 8,374 | 8,644 | 8,824 | → |
| Oostrozebeke | Municipality | Tielt | 6,431 | 6,705 | 6,940 | 7,367 | 7,528 | 7,700 | 7,943 | 7,972 | → |
| Pittem | Municipality | Tielt | 6,068 | 6,251 | 6,470 | 6,594 | 6,719 | 6,723 | 6,784 | 7,003 | → |
| Tielt | Municipality | Tielt | 29,661 | 29,574 | 30,133 | 30,151 | 30,781 | 31,177 | 31,275 | 31,973 | → |
| Wielsbeke | Municipality | Tielt | 7,782 | 8,221 | 8,389 | 8,936 | 9,177 | 9,525 | 9,851 | 10,282 | → |
| Wingene | Municipality | Tielt | 17,458 | 17,214 | 16,882 | 17,659 | 19,097 | 19,572 | 20,078 | 20,919 | → |
Source: Statistics Belgium.
Further information about the population structure:
| Gender (E 2026) | |
|---|---|
| Males | 48,386 |
| Females | 48,133 |
| Age Groups (E 2026) | |
|---|---|
| 0-17 years | 18,334 |
| 18-64 years | 56,718 |
| 65+ years | 21,467 |
| Age Distribution (E 2026) | |
|---|---|
| 90+ years | 1,529 |
| 80-89 years | 5,098 |
| 70-79 years | 8,924 |
| 60-69 years | 12,738 |
| 50-59 years | 12,698 |
| 40-49 years | 12,011 |
| 30-39 years | 12,352 |
| 20-29 years | 10,712 |
| 10-19 years | 10,712 |
| 0-9 years | 9,745 |
| Citizenship (E 2026) | |
|---|---|
| Belgium | 90,190 |
| Other Citizenship | 6,329 |