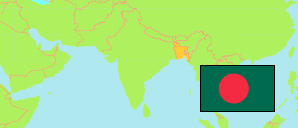
Mymensingh
Division in Bangladesh
Contents: Subdivision
The population development in Mymensingh as well as related information and services (Wikipedia, Google, images).
| Name | Status | Transcription | Native | Population Census 1991-03-13 | Population Census 2001-01-22 | Population Census 2011-03-15 | Population Census 2022-06-14 | |
|---|---|---|---|---|---|---|---|---|
| Mymensingh | Division | Maẏamanasiṁha | ময়মনসিংহ বিভাগ | 9,010,000 | 10,321,282 | 11,427,765 | 12,637,472 | |
| Jamalpur | District | Jāmālapura | জামালপুর জেলা | 1,943,000 | 2,205,766 | 2,384,811 | 2,583,984 | → |
| Mymensingh | District | Maẏamanasiṁha | ময়মনসিংহ জেলা | 4,097,000 | 4,696,966 | 5,313,163 | 6,097,814 | → |
| Netrakona [Netrokona] | District | Nētrakōnā | নেত্রকোনা জেলা | 1,791,000 | 2,079,716 | 2,317,190 | 2,403,205 | → |
| Sherpur | District | Śērapura | শেরপুর জেলা | 1,179,000 | 1,338,834 | 1,412,601 | 1,552,469 | → |
| Bangladesh | People's Republic | Bā̃lādēśa | বাংলাদেশ | 111,456,000 | 130,522,598 | 149,772,364 | 169,828,911 |
Source: Bangladesh Bureau of Statistics.
Explanation: The totals are adjusted for underenumeration; the population structure presents unadjusted figures. The 2022 population of districts is adjusted by using the official adjustment factor of the corresponding division.
Further information about the population structure:
| Gender (C 2022) | |
|---|---|
| Males | 5,988,233 |
| Females | 6,236,557 |
| Hijra | 659 |
| Age Groups (C 2022) | |
|---|---|
| 0-14 years | 3,786,154 |
| 15-64 years | 7,625,116 |
| 65+ years | 813,520 |
| Age Distribution (C 2022) | |
|---|---|
| 90+ years | 40,123 |
| 80-89 years | 112,905 |
| 70-79 years | 336,527 |
| 60-69 years | 784,556 |
| 50-59 years | 1,036,211 |
| 40-49 years | 1,293,460 |
| 30-39 years | 1,682,163 |
| 20-29 years | 1,960,784 |
| 10-19 years | 2,498,362 |
| 0-9 years | 2,479,699 |
| Urbanization (C 2022) | |
|---|---|
| Rural | 9,493,548 |
| Urban | 2,731,901 |
| Religion (C 2022) | |
|---|---|
| Muslims | 11,682,908 |
| Hindus | 481,721 |
| Buddhists | 753 |
| Christians | 56,800 |
| Other Religion | 2,608 |