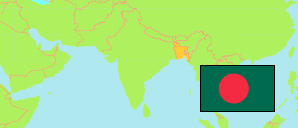
Dhaka
Division in Bangladesh
Contents: Subdivision
The population development in Dhaka as well as related information and services (Wikipedia, Google, images).
| Name | Status | Transcription | Native | Population Census 1991-03-13 | Population Census 2001-01-22 | Population Census 2011-03-15 | Population Census 2022-06-14 | |
|---|---|---|---|---|---|---|---|---|
| Dhaka | Division | Ḍhākā | ঢাকা বিভাগ | 24,931,000 | 30,806,667 | 37,893,924 | 45,644,586 | |
| Dhaka | District | Ḍhākā | ঢাকা জেলা | 6,164,000 | 9,151,343 | 12,517,360 | 15,210,851 | → |
| Faridpur | District | Pharidapura | ফরিদপুর জেলা | 1,559,000 | 1,837,631 | 1,988,695 | 2,232,772 | → |
| Gazipur | District | Gājīpura | গাজীপুর জেলা | 1,683,000 | 2,142,179 | 3,548,115 | 5,433,538 | → |
| Gopalganj | District | Gōpālagañja | গোপালগঞ্জ জেলা | 1,097,000 | 1,218,789 | 1,218,319 | 1,336,907 | → |
| Kishoreganj | District | Kiśōragañja | কিশোরগঞ্জ জেলা | 2,388,000 | 2,714,721 | 3,028,706 | 3,373,219 | → |
| Madaripur | District | Mādārīpura | মাদারীপুর জেলা | 1,106,000 | 1,199,374 | 1,212,199 | 1,334,811 | → |
| Manikganj | District | Mānikagañja | মানিকগঞ্জ জেলা | 1,216,000 | 1,343,468 | 1,447,301 | 1,608,372 | → |
| Munshiganj | District | Munsigañja | মুন্সিগঞ্জ জেলা | 1,229,000 | 1,353,615 | 1,502,449 | 1,677,941 | → |
| Narayanganj | District | Nārāẏaṇagañja | নারায়ণগঞ্জ জেলা | 1,819,000 | 2,289,797 | 3,074,078 | 4,035,461 | → |
| Narsingdi | District | Narasiṁdī | নরসিংদী জেলা | 1,710,000 | 1,983,571 | 2,314,889 | 2,667,968 | → |
| Rajbari | District | Rājabāṛī | রাজবাড়ী জেলা | 866,000 | 996,147 | 1,091,263 | 1,228,267 | → |
| Shariatpur | District | Śariẏatapura | শরিয়তপুর জেলা | 986,000 | 1,132,535 | 1,201,464 | 1,336,396 | → |
| Tangail | District | Ṭāṅgāila | টাঙ্গাইল জেলা | 3,108,000 | 3,443,497 | 3,749,086 | 4,168,083 | → |
| Bangladesh | People's Republic | Bā̃lādēśa | বাংলাদেশ | 111,456,000 | 130,522,598 | 149,772,364 | 169,828,911 |
Source: Bangladesh Bureau of Statistics.
Explanation: The totals are adjusted for underenumeration; the population structure presents unadjusted figures. The 2022 population of districts is adjusted by using the official adjustment factor of the corresponding division.
Further information about the population structure:
| Gender (C 2022) | |
|---|---|
| Males | 22,482,503 |
| Females | 21,730,775 |
| Hijra | 2,481 |
| Age Groups (C 2022) | |
|---|---|
| 0-14 years | 11,735,523 |
| 15-64 years | 30,217,833 |
| 65+ years | 2,259,922 |
| Age Distribution (C 2022) | |
|---|---|
| 90+ years | 97,185 |
| 80-89 years | 291,640 |
| 70-79 years | 961,406 |
| 60-69 years | 2,256,431 |
| 50-59 years | 3,371,880 |
| 40-49 years | 4,902,385 |
| 30-39 years | 7,222,410 |
| 20-29 years | 8,949,726 |
| 10-19 years | 8,513,946 |
| 0-9 years | 7,646,269 |
| Urbanization (C 2022) | |
|---|---|
| Rural | 23,455,658 |
| Urban | 20,760,101 |
| Religion (C 2022) | |
|---|---|
| Muslims | 41,295,740 |
| Hindus | 2,766,723 |
| Buddhists | 20,341 |
| Christians | 124,349 |
| Other Religion | 6,125 |