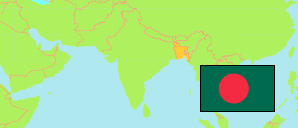
Chittagong
Division in Bangladesh
Contents: Subdivision
The population development in Chittagong as well as related information and services (Wikipedia, Google, images).
| Name | Status | Transcription | Native | Population Census 1991-03-13 | Population Census 2001-01-22 | Population Census 2011-03-15 | Population Census 2022-06-14 | |
|---|---|---|---|---|---|---|---|---|
| Chittagong | Division | Caṭṭagrāma | চট্টগ্রাম বিভাগ | 21,865,000 | 25,505,197 | 29,553,857 | 34,178,612 | |
| Bandarban | District | Bāndarabāna | বান্দরবান জেলা | 246,000 | 311,741 | 404,091 | 495,252 | → |
| Brahmanbaria | District | Brāhmaṇabāṛīẏā | ব্রাহ্মণবাড়ীয়া জেলা | 2,268,000 | 2,509,383 | 2,953,208 | 3,403,786 | → |
| Chandpur | District | Cā̃dapura | চাঁদপুর জেলা | 2,150,000 | 2,377,088 | 2,513,838 | 2,713,247 | → |
| Chittagong | District | Caṭṭagrāma | চট্টগ্রাম জেলা | 5,744,000 | 7,009,504 | 7,913,366 | 9,439,076 | → |
| Comilla | District | Kumillā | কুমিল্লা জেলা | 4,264,000 | 4,807,649 | 5,602,624 | 6,394,875 | → |
| Cox's Bazar | District | Kaksabājāra | কক্সবাজার জেলা | 1,502,000 | 1,856,151 | 2,381,814 | 2,906,281 | → |
| Feni | District | Phēnī | ফেনী জেলা | 1,158,000 | 1,297,987 | 1,496,139 | 1,697,379 | → |
| Khagrachhari | District | Khāgaṛāchaṛi | খাগড়াছড়ি জেলা | 366,000 | 549,134 | 638,967 | 735,116 | → |
| Lakshmipur | District | Lakṣmīpura | লক্ষ্মীপুর জেলা | 1,391,000 | 1,558,618 | 1,797,761 | 1,994,930 | → |
| Noakhali | District | Nōẏākhālī | নোয়াখালী জেলা | 2,346,000 | 2,696,453 | 3,231,832 | 3,732,042 | → |
| Rangamati | District | Rāṅgāmāṭi | রাঙ্গামাটি জেলা | 430,000 | 531,489 | 620,215 | 666,627 | → |
| Bangladesh | People's Republic | Bā̃lādēśa | বাংলাদেশ | 111,456,000 | 130,522,598 | 149,772,364 | 169,828,911 |
Source: Bangladesh Bureau of Statistics.
Explanation: The totals are adjusted for underenumeration; the population structure presents unadjusted figures. The 2022 population of districts is adjusted by using the official adjustment factor of the corresponding division.
Further information about the population structure:
| Gender (C 2022) | |
|---|---|
| Males | 16,035,140 |
| Females | 17,165,884 |
| Hijra | 1,333 |
| Age Groups (C 2022) | |
|---|---|
| 0-14 years | 10,651,598 |
| 15-64 years | 20,756,189 |
| 65+ years | 1,793,237 |
| Age Distribution (C 2022) | |
|---|---|
| 90+ years | 81,768 |
| 80-89 years | 242,658 |
| 70-79 years | 770,244 |
| 60-69 years | 1,701,009 |
| 50-59 years | 2,342,133 |
| 40-49 years | 3,206,532 |
| 30-39 years | 4,622,206 |
| 20-29 years | 5,989,990 |
| 10-19 years | 7,183,243 |
| 0-9 years | 7,061,241 |
| Urbanization (C 2022) | |
|---|---|
| Rural | 22,018,168 |
| Urban | 11,184,189 |
| Religion (C 2022) | |
|---|---|
| Muslims | 29,934,549 |
| Hindus | 2,196,881 |
| Buddhists | 969,605 |
| Christians | 72,915 |
| Other Religion | 27,074 |