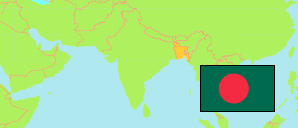
Bangladesh: Chittagong
Contents: City Districts and Subdistricts
The population of the city districts (thanas) and subdistricts (upazilas) in the Metropolitan Area of Chittagong by census years.
| Name | Status | Transcription | Native | Population Census 1991-03-13 | Population Census 2001-01-22 | Population Census 2011-03-15 | |
|---|---|---|---|---|---|---|---|
| Bairag | Union | Bairāga | বৈরাগ ইউনিয়ন | 21,176 | 11,066 | 30,545 | → |
| Bakalia | City District | Bākaliẏā | বাকলিয়া থানা | 113,446 | 196,877 | 262,703 | → |
| Bandar | City District | Bandara | বন্দর থানা | 108,816 | 213,598 | 208,260 | → |
| Bayejid | City District | Bāẏējīda | বায়েজীদ থানা | 121,827 | 168,051 | 211,355 | → |
| Chandgaon | City District | Cā̃ndagāō | চাঁন্দগাও থানা | 111,210 | 178,390 | 256,411 | → |
| Double Mooring | City District | Ḍābalamuriṁ | ডাবলমুরিং থানা | 222,165 | 259,181 | 361,154 | → |
| Halishahar | City District | Hāliśahara | হালিশহর থানা | 73,993 | 125,255 | 151,515 | → |
| Hathazari | Subdistrict | Hāṭahājārī | হাটহাজারী উপজেলা | 294,515 | 403,788 | 431,748 | → |
| Khulshi | City District | Khulaśī | খুলশী থানা | 152,657 | 243,351 | 278,623 | → |
| Kotwali | City District | Kōtōẏālī | কোতোয়ালী থানা | 201,175 | 282,975 | 319,972 | → |
| Pahartali | City District | Pāhāṛatalī | পাহাড়তলী থানা | 95,618 | 127,243 | 190,637 | → |
| Panchlaish | City District | Pā̃calāiśa | পাঁচলাইশ থানা | 113,127 | 148,120 | 219,132 | → |
| Paschim Gomdandi | Union | Paścima Gōmadaṇḍī | পশ্চিম গোমদণ্ডী ইউনিয়ন | 28,249 | 33,893 | 38,739 | → |
| Patenga | City District | Patēṅgā | পতেঙ্গা থানা | 78,924 | 80,448 | 132,677 | → |
| Patiya [incl. 6 Unions in Karnafuli] | Subdistrict | Paṭiẏā | পটিয়া উপজেলা | 398,836 | 458,037 | 528,120 | → |
| Sitakunda | Subdistrict | Sītākuṇḍa | সীতাকুণ্ড উপজেলা | 274,903 | 335,178 | 387,832 | → |
| Chittagong | Statistical Metropolitan Area | Caṭṭagrāma | চট্টগ্রাম | 2,410,637 | 3,265,451 | 4,009,423 |
Source: Bangladesh Bureau of Statistics (web).