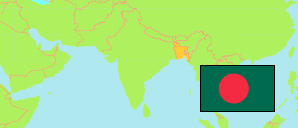
Shibganj
Subdistrict in Bangladesh
Contents: Population
The population development of Shibganj as well as related information and services (Wikipedia, Google, images).
| Name | Status | Transcription | Native | Population Census 1991-03-13 | Population Census 2001-01-22 | Population Census 2011-03-15 | Population Census 2022-06-14 | |
|---|---|---|---|---|---|---|---|---|
| Shibganj | Subdistrict | Śibagañja | শিবগঞ্জ উপজেলা | 312,773 | 352,415 | 378,700 | 400,407 | |
| Bangladesh | People's Republic | Bā̃lādēśa | বাংলাদেশ | 106,314,992 | 124,355,263 | 144,043,697 | 165,158,616 |
Source: Bangladesh Bureau of Statistics.
Explanation: The tabulated figures are not adjusted for underenumeration. 2022 subdistrict figures exclude hijra. Some area figures are derived from geospatial data.
Further information about the population structure:
| Gender (C 2022) | |
|---|---|
| males | 196,824 |
| females | 203,583 |