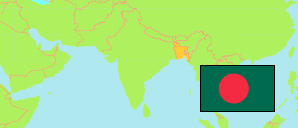
Habiganj
District in Bangladesh
Contents: Subdivision
The population development in Habiganj as well as related information and services (Wikipedia, Google, images).
| Name | Status | Transcription | Native | Population Census 1991-03-13 | Population Census 2001-01-22 | Population Census 2011-03-15 | Population Census 2022-06-14 | |
|---|---|---|---|---|---|---|---|---|
| Habiganj | District | Habigañja | হবিগঞ্জ জেলা | 1,526,609 | 1,757,665 | 2,089,001 | 2,358,886 | |
| Ajmiriganj | Subdistrict | Ājamirīgañja | আজমিরীগঞ্জ উপজেলা | 86,810 | 99,294 | 114,265 | 126,324 | → |
| Bahubal | Subdistrict | Bāhubala | বাহুবল উপজেলা | 137,402 | 167,265 | 197,997 | 219,377 | → |
| Baniachang | Subdistrict | Bāniẏācaṁ | বানিয়াচং উপজেলা | 235,855 | 268,691 | 332,530 | 356,425 | → |
| Chunarughat | Subdistrict | Cunārughāṭa | চুনারুঘাট উপজেলা | 233,752 | 267,056 | 302,110 | 342,289 | → |
| Habiganj Sadar | Subdistrict | Habigañja Sadara | হবিগঞ্জ সদর উপজেলা | 181,946 | 220,527 | 263,695 | 306,718 | → |
| Lakhai | Subdistrict | Lākhāi | লাখাই উপজেলা | 110,319 | 120,677 | 148,811 | 158,717 | → |
| Madhabpur | Subdistrict | Mādhabapura | মাধবপুর উপজেলা | 250,069 | 272,578 | 319,016 | 384,243 | → |
| Nabiganj | Subdistrict | Nabīgañja | নবীগঞ্জ উপজেলা | 246,933 | 287,030 | 345,179 | 367,385 | → |
| Shayestaganj [← Habiganj Sadar] | Subdistrict | Śāẏestāgañja | শায়েস্তাগঞ্জ উপজেলা | 43,523 | 54,547 | 65,398 | 97,408 | → |
| Bangladesh | People's Republic | Bā̃lādēśa | বাংলাদেশ | 106,314,992 | 124,355,263 | 144,043,697 | 165,158,616 |
Source: Bangladesh Bureau of Statistics.
Explanation: The tabulated figures are not adjusted for underenumeration. Some area figures are derived from geospatial data.
Further information about the population structure:
| Gender (C 2022) | |
|---|---|
| Males | 1,143,901 |
| Females | 1,214,846 |
| Hijra | 139 |
| Age Groups (C 2022) | |
|---|---|
| 0-14 years | 784,275 |
| 15-64 years | 1,445,058 |
| 65+ years | 129,414 |
| Age Distribution (C 2022) | |
|---|---|
| 90+ years | 6,941 |
| 80-89 years | 19,292 |
| 70-79 years | 56,431 |
| 60-69 years | 120,998 |
| 50-59 years | 163,762 |
| 40-49 years | 216,600 |
| 30-39 years | 309,790 |
| 20-29 years | 419,166 |
| 10-19 years | 523,720 |
| 0-9 years | 522,047 |
| Urbanization (C 2022) | |
|---|---|
| Rural | 2,004,395 |
| Urban | 354,491 |
| Religion (C 2022) | |
|---|---|
| Muslims | 1,980,964 |
| Hindus | 374,091 |
| Buddhists | 210 |
| Christians | 2,551 |
| Other Religion | 931 |