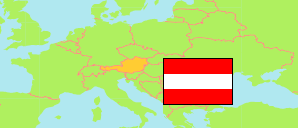
Salzburg
State in Austria
Contents: Subdivision
The population development in Salzburg as well as related information and services (Wikipedia, Google, images).
| Name | Status | Population Census 1981-05-12 | Population Census 1991-05-15 | Population Census 2001-05-15 | Population Census 2011-10-31 | Population Census 2021-10-31 | Population Estimate 2025-01-01 | |
|---|---|---|---|---|---|---|---|---|
| Salzburg | State | 442,301 | 482,365 | 515,454 | 529,066 | 561,714 | 572,905 | |
| Hallein | District | 44,815 | 50,396 | 54,281 | 57,651 | 61,162 | 62,115 | → |
| Salzburg (Stadt) | District | 139,426 | 143,978 | 142,808 | 145,270 | 154,604 | 157,659 | → |
| Salzburg-Umgebung | District | 98,733 | 118,137 | 135,100 | 143,081 | 155,695 | 159,208 | → |
| Sankt Johann im Pongau | District | 67,410 | 71,955 | 77,865 | 78,138 | 81,686 | 83,310 | → |
| Tamsweg | District | 20,106 | 20,622 | 21,282 | 20,502 | 20,169 | 20,460 | → |
| Zell am See | District | 71,811 | 77,277 | 84,118 | 84,424 | 88,398 | 90,094 | → |
| Österreich [Austria] | Republic | 7,555,338 | 7,795,786 | 8,032,857 | 8,401,940 | 8,969,068 | 9,197,213 |
Source: Statistik Austria.
Explanation: 2025 population figures are final estimates.
Further information about the population structure:
| Gender (E 2025) | |
|---|---|
| Males | 280,487 |
| Females | 292,359 |
| Age Groups (E 2025) | |
|---|---|
| 0-17 years | 99,120 |
| 18-64 years | 356,440 |
| 65+ years | 117,286 |
| Age Distribution (E 2025) | |
|---|---|
| 90+ years | 5,052 |
| 80-89 years | 29,624 |
| 70-79 years | 49,100 |
| 60-69 years | 74,808 |
| 50-59 years | 83,087 |
| 40-49 years | 74,926 |
| 30-39 years | 78,557 |
| 20-29 years | 67,148 |
| 10-19 years | 55,294 |
| 0-9 years | 55,250 |
| Citizenship (E 2025) | |
|---|---|
| Austria | 453,924 |
| EU, EFTA, UK | 63,691 |
| Other Citizenship | 55,231 |
| Country of Birth (E 2025) | |
|---|---|
| Austria | 446,912 |
| EU, EFTA, UK | 61,615 |
| Other country | 64,319 |