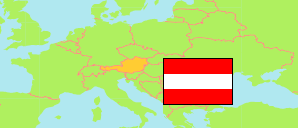
Kärnten
State in Austria
Contents: Subdivision
The population development in Kärnten as well as related information and services (Wikipedia, Google, images).
| Name | Status | Population Census 1981-05-12 | Population Census 1991-05-15 | Population Census 2001-05-15 | Population Census 2011-10-31 | Population Census 2021-10-31 | Population Estimate 2025-01-01 | |
|---|---|---|---|---|---|---|---|---|
| Kärnten [Carinthia] | State | 536,179 | 547,798 | 559,346 | 556,173 | 564,328 | 570,194 | |
| Feldkirchen | District | 27,268 | 28,632 | 30,272 | 30,285 | 29,880 | 30,111 | → |
| Hermagor | District | 20,092 | 20,245 | 19,752 | 18,718 | 18,064 | 17,941 | → |
| Klagenfurt Land | District | 49,572 | 52,874 | 56,384 | 58,499 | 60,945 | 62,060 | → |
| Klagenfurt (Stadt) | District | 87,321 | 89,415 | 90,145 | 94,483 | 102,527 | 105,256 | → |
| Sankt Veit an der Glan | District | 59,209 | 58,850 | 58,733 | 56,061 | 53,911 | 53,950 | → |
| Spittal an der Drau | District | 79,710 | 80,802 | 81,706 | 78,043 | 75,578 | 75,545 | → |
| Villach Land | District | 60,642 | 62,596 | 64,685 | 64,499 | 65,166 | 65,656 | → |
| Villach (Stadt) | District | 52,692 | 54,640 | 57,492 | 59,324 | 63,935 | 65,749 | → |
| Völkermarkt | District | 43,236 | 43,441 | 43,570 | 42,237 | 41,929 | 41,981 | → |
| Wolfsberg | District | 56,437 | 56,303 | 56,607 | 54,024 | 52,393 | 51,846 | → |
| Österreich [Austria] | Republic | 7,555,338 | 7,795,786 | 8,032,857 | 8,401,940 | 8,969,068 | 9,197,213 |
Source: Statistik Austria.
Explanation: 2025 population figures are final estimates.
Further information about the population structure:
| Gender (E 2025) | |
|---|---|
| Males | 278,679 |
| Females | 291,416 |
| Age Groups (E 2025) | |
|---|---|
| 0-17 years | 90,118 |
| 18-64 years | 342,577 |
| 65+ years | 137,400 |
| Age Distribution (E 2025) | |
|---|---|
| 90+ years | 6,419 |
| 80-89 years | 34,319 |
| 70-79 years | 56,224 |
| 60-69 years | 87,289 |
| 50-59 years | 86,517 |
| 40-49 years | 71,653 |
| 30-39 years | 69,871 |
| 20-29 years | 56,530 |
| 10-19 years | 53,163 |
| 0-9 years | 48,110 |
| Citizenship (E 2025) | |
|---|---|
| Austria | 492,337 |
| EU, EFTA, UK | 48,889 |
| Other Citizenship | 28,869 |
| Country of Birth (E 2025) | |
|---|---|
| Austria | 482,846 |
| EU, EFTA, UK | 47,296 |
| Other country | 39,953 |