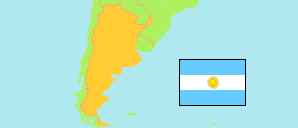
Jujuy
Province in Argentina
Contents: Subdivision
The population development in Jujuy as well as related information and services (Wikipedia, Google, images).
| Name | Status | Population Census 1991-05-15 | Population Census 2001-11-17 | Population Census 2010-10-27 | Population Census 2022-05-18 | |
|---|---|---|---|---|---|---|
| Jujuy | Province | 512,329 | 611,888 | 673,307 | 811,611 | |
| Cochinoca | Department | 9,859 | 12,111 | 12,656 | 15,054 | → |
| Doctor Manuel Belgrano | Department | 184,920 | 238,012 | 265,249 | 320,990 | → |
| El Carmen | Department | 62,291 | 84,667 | 97,039 | 122,366 | → |
| Humahuaca | Department | 18,183 | 16,765 | 17,366 | 20,914 | → |
| Ledesma | Department | 68,869 | 75,716 | 81,790 | 94,252 | → |
| Palpalá | Department | 43,521 | 48,199 | 52,631 | 65,541 | → |
| Rinconada | Department | 3,076 | 2,298 | 2,488 | 1,802 | → |
| San Antonio | Department | 2,704 | 3,698 | 4,466 | 6,729 | → |
| San Pedro | Department | 66,130 | 71,037 | 75,037 | 88,241 | → |
| Santa Bárbara | Department | 15,607 | 17,115 | 17,730 | 20,499 | → |
| Santa Catalina | Department | 3,176 | 3,140 | 2,800 | 2,646 | → |
| Susques | Department | 2,846 | 3,628 | 3,791 | 4,098 | → |
| Tilcara | Department | 8,463 | 10,403 | 12,349 | 14,721 | → |
| Tumbaya | Department | 4,175 | 4,553 | 4,658 | 5,381 | → |
| Valle Grande | Department | 1,976 | 2,386 | 2,451 | 2,509 | → |
| Yavi | Department | 16,533 | 18,160 | 20,806 | 25,868 | → |
| Argentina | Republic | 32,615,528 | 36,260,130 | 40,117,096 | 45,892,285 |
Source: Instituto Nacional de Estadística y Censos de la Republica Argentina.
Explanation: The results of the 2022 census are final.
Further information about the population structure:
| Gender (C 2022) | |
|---|---|
| Males | 393,590 |
| Females | 418,021 |
| Age Groups (C 2022) | |
|---|---|
| 0-14 years | 189,598 |
| 15-64 years | 541,582 |
| 65+ years | 80,349 |
| Age Distribution (C 2022) | |
|---|---|
| 90+ years | 2,569 |
| 80-89 years | 14,051 |
| 70-79 years | 35,901 |
| 60-69 years | 59,475 |
| 50-59 years | 77,415 |
| 40-49 years | 112,708 |
| 30-39 years | 120,334 |
| 20-29 years | 133,421 |
| 10-19 years | 135,595 |
| 0-9 years | 120,060 |