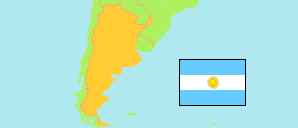
Corrientes
Province in Argentina
Contents: Subdivision
The population development in Corrientes as well as related information and services (Wikipedia, Google, images).
| Name | Status | Population Census 1991-05-15 | Population Census 2001-11-17 | Population Census 2010-10-27 | Population Census 2022-05-18 | |
|---|---|---|---|---|---|---|
| Corrientes | Province | 795,594 | 930,991 | 992,595 | 1,212,696 | |
| Bella Vista | Department | 30,966 | 35,350 | 37,181 | 44,406 | → |
| Berón de Astrada | Department | 2,280 | 2,294 | 2,461 | 2,826 | → |
| Capital | Department | 268,080 | 328,868 | 358,223 | 439,270 | → |
| Concepción | Department | 14,856 | 18,411 | 21,113 | 26,282 | → |
| Curuzú Cuatiá | Department | 39,922 | 42,075 | 44,384 | 51,532 | → |
| Empedrado | Department | 13,188 | 14,721 | 15,109 | 17,968 | → |
| Esquina | Department | 26,157 | 30,372 | 30,802 | 39,185 | → |
| General Alvear | Department | 7,493 | 8,147 | 7,926 | 9,145 | → |
| General Paz | Department | 13,764 | 14,775 | 14,836 | 17,020 | → |
| Goya | Department | 78,894 | 87,349 | 89,959 | 106,371 | → |
| Itatí | Department | 7,228 | 8,774 | 9,171 | 12,010 | → |
| Ituzaingó | Department | 28,685 | 30,565 | 31,150 | 38,837 | → |
| Lavalle | Department | 19,457 | 26,250 | 28,759 | 40,448 | → |
| Mburucuyá | Department | 8,188 | 9,012 | 9,252 | 11,568 | → |
| Mercedes | Department | 33,948 | 39,206 | 40,667 | 49,882 | → |
| Monte Caseros | Department | 29,390 | 33,684 | 36,338 | 45,670 | → |
| Paso de los Libres | Department | 41,129 | 46,326 | 48,642 | 56,989 | → |
| Saladas | Department | 19,747 | 21,470 | 22,244 | 29,198 | → |
| San Cosme | Department | 9,598 | 13,189 | 14,381 | 19,706 | → |
| San Luis del Palmar | Department | 14,336 | 16,513 | 17,590 | 21,459 | → |
| San Martín | Department | 11,017 | 12,236 | 13,140 | 15,187 | → |
| San Miguel | Department | 9,169 | 10,252 | 10,572 | 12,713 | → |
| San Roque | Department | 16,039 | 17,951 | 18,366 | 22,715 | → |
| Santo Tomé | Department | 43,360 | 54,050 | 61,297 | 71,927 | → |
| Sauce | Department | 8,703 | 9,151 | 9,032 | 10,382 | → |
| Argentina | Republic | 32,615,528 | 36,260,130 | 40,117,096 | 45,892,285 |
Source: Instituto Nacional de Estadística y Censos de la Republica Argentina.
Explanation: The results of the 2022 census are final.
Further information about the population structure:
| Gender (C 2022) | |
|---|---|
| Males | 589,009 |
| Females | 623,687 |
| Age Groups (C 2022) | |
|---|---|
| 0-14 years | 291,713 |
| 15-64 years | 798,922 |
| 65+ years | 121,994 |
| Age Distribution (C 2022) | |
|---|---|
| 90+ years | 4,165 |
| 80-89 years | 20,542 |
| 70-79 years | 54,150 |
| 60-69 years | 92,528 |
| 50-59 years | 115,549 |
| 40-49 years | 148,611 |
| 30-39 years | 176,868 |
| 20-29 years | 206,003 |
| 10-19 years | 204,376 |
| 0-9 years | 189,837 |
