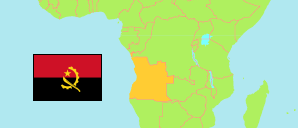
Cuando Cubango
Province in Angola
Contents: Subdivision
The population in Cuando Cubango as well as related information and services (Wikipedia, Google, images).
| Name | Status | Population Census 2014-05-16 | |
|---|---|---|---|
| Cuando Cubango | Province | 534,002 | |
| Baixo Longa | Commune | 1,352 | → |
| Bondo | Commune | 1,868 | → |
| Caiundo | Commune | 14,665 | → |
| Calai | Commune | 20,091 | → |
| Chamavera | Commune | 4,975 | → |
| Chinguanja | Commune | 3,612 | → |
| Cuangar | Commune | 13,300 | → |
| Cuchi | Commune | 20,361 | → |
| Cueio | Commune | 4,247 | → |
| Cuito Cuanavale | Commune | 22,774 | → |
| Cunjamba-Dima | Commune | 1,064 | → |
| Cutato | Commune | 15,031 | → |
| Cutuile | Commune | 2,334 | → |
| Dirico | Commune | 6,549 | → |
| Longa | Commune | 15,104 | → |
| Luengue | Commune | 3,547 | → |
| Luiana | Commune | 8,010 | → |
| Lupire | Commune | 1,600 | → |
| Maue | Commune | 831 | → |
| Mavengue | Commune | 1,732 | → |
| Mavinga | Commune | 20,251 | → |
| Menongue | Commune | 292,533 | → |
| Missombo | Commune | 9,469 | → |
| Mucusso | Commune | 3,602 | → |
| Nancova | Commune | 1,890 | → |
| Nerinquinha | Commune | 1,331 | → |
| Rito | Commune | 906 | → |
| Rivungo | Commune | 15,115 | → |
| Savate | Commune | 13,291 | → |
| Vissati | Commune | 3,971 | → |
| Xipundo | Commune | 8,598 | → |
| Angola | Republic | 25,789,024 |
Source: Instituto Nacional de Estatística, República de Angola.
Explanation: Provinces and communes in the boundaries during the 2014 census. Their area figures are derived from imprecise geometries.
Further information about the population structure:
| Gender (C 2014) | |
|---|---|
| Males | 260,585 |
| Females | 273,417 |
| Age Groups (C 2014) | |
|---|---|
| 0-14 years | 247,753 |
| 15-64 years | 271,210 |
| 65+ years | 15,038 |
| Age Distribution (C 2014) | |
|---|---|
| 0-9 years | 187,954 |
| 10-19 years | 113,935 |
| 20-29 years | 93,126 |
| 30-39 years | 54,791 |
| 40-49 years | 36,304 |
| 50-59 years | 24,562 |
| 60-69 years | 12,863 |
| 70-79 years | 6,973 |
| 80+ years | 3,492 |
| Literacy (A15+) (C 2014) | |
|---|---|
| yes | 160,145 |
| no | 126,104 |
| Religion (C 2014) | |
|---|---|
| Catholics | 235,964 |
| Protestants | 249,693 |
| Indigenous religion | 166 |
| Muslims | 605 |
| Jews | 732 |
| Other religion | 18,742 |
| No religion | 28,100 |