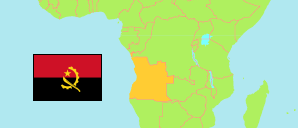
Moxico
Province in Angola
Contents: Subdivision
The population in Moxico as well as related information and services (Wikipedia, Google, images).
| Name | Status | Population Census 2014-05-16 | |
|---|---|---|---|
| Moxico | Province | 758,568 | |
| Caianda | Commune | 5,492 | → |
| Calunda | Commune | 9,440 | → |
| Camanongue | Commune | 34,167 | → |
| Cameia | Commune | 29,476 | → |
| Cangamba (Cangombe) | Commune | 1,482 | → |
| Cangumbe (Kachipoque) | Commune | 12,110 | → |
| Caquengue | Commune | 11,537 | → |
| Cassamba | Commune | 1,642 | → |
| Cazombo (Alto Zambeze) | Commune | 64,536 | → |
| Chiume | Commune | 9,273 | → |
| Lago Dilolo | Commune | 10,824 | → |
| Léua | Commune | 18,552 | → |
| Liangongo (Sandando) | Commune | 13,905 | → |
| Lóvua do Zambeze | Commune | 5,677 | → |
| Luacano | Commune | 9,931 | → |
| Luau | Commune | 89,453 | → |
| Luchazes | Commune | 5,958 | → |
| Lucusse | Commune | 19,061 | → |
| Luena | Commune | 320,132 | → |
| Lumbala Nguimbo | Commune | 30,297 | → |
| Lutembo | Commune | 7,919 | → |
| Lutuai (Muangai) | Commune | 6,110 | → |
| Luvuei | Commune | 6,319 | → |
| Macondo | Commune | 3,021 | → |
| Muié | Commune | 778 | → |
| Mussuma | Commune | 8,372 | → |
| Nana Candundo | Commune | 11,197 | → |
| Ninda | Commune | 6,937 | → |
| Sessa | Commune | 380 | → |
| Tempué | Commune | 4,591 | → |
| Angola | Republic | 25,789,024 |
Source: Instituto Nacional de Estatística, República de Angola.
Explanation: Provinces and communes in the boundaries during the 2014 census. Their area figures are derived from imprecise geometries.
Further information about the population structure:
| Gender (C 2014) | |
|---|---|
| Males | 369,437 |
| Females | 389,131 |
| Age Groups (C 2014) | |
|---|---|
| 0-14 years | 383,988 |
| 15-64 years | 352,449 |
| 65+ years | 22,132 |
| Age Distribution (C 2014) | |
|---|---|
| 0-9 years | 295,294 |
| 10-19 years | 157,822 |
| 20-29 years | 111,008 |
| 30-39 years | 77,262 |
| 40-49 years | 50,528 |
| 50-59 years | 32,370 |
| 60-69 years | 19,354 |
| 70-79 years | 10,219 |
| 80+ years | 4,711 |
| Literacy (A15+) (C 2014) | |
|---|---|
| yes | 178,388 |
| no | 196,192 |
| Religion (C 2014) | |
|---|---|
| Catholics | 104,985 |
| Protestants | 473,540 |
| Indigenous religion | 3,790 |
| Muslims | 1,732 |
| Jews | 1,111 |
| Other religion | 32,378 |
| No religion | 141,032 |