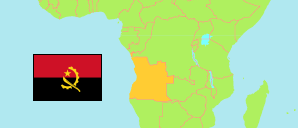
HomeAdministrative Division
Tweet
Facebook
Show Map

Lunda Sul

Province in Angola

Contents: Subdivision

The population development in Lunda Sul as well as related information and services (Wikipedia, Google, images).

The Details icon links to further information about a selected division including its population structure (gender, age groups, age distribution, urbanization, literacy (a15+), spoken language(s), religion).

NameStatusPopulation
Census
2014-05-16
Population
Projection
2022-07-01
Lunda SulProvince537,587690,073
CacoloMunicipality31,89540,946
DalaMunicipality29,99138,503
MucondaMunicipality33,26442,702
SaurimoMunicipality442,437567,922
AngolaRepublic25,789,02433,086,278

Source: Instituto Nacional de Estatística, República de Angola (web).

Explanation: Area figures of municipalities are derived from imprecise geometries.


Further information about the population structure:

MalesFemales49.7%50.3%
GenderPersons
Males342,904
Females347,169
Gender (P 2022)
Males342,904
Females347,169
0-14 years15-64years65+ years48.7%49.2%
Age GroupsPersons
0-14 years261,706
15-64 years264,687
65+ years11,194
Age Groups (C 2014)
0-14 years261,706
15-64 years264,687
65+ years11,194
0-9 years10-19 years20-29 years30-39 years40-49 years50-59 years60-69 years70-79 years80+ years
Age DistributionPersons
0-9 years202,122
10-19 years109,676
20-29 years79,964
30-39 years61,763
40-49 years42,381
50-59 years23,274
60-69 years11,131
70-79 years5,149
80+ years2,129
Age Distribution (C 2014)
0-9 years202,122
10-19 years109,676
20-29 years79,964
30-39 years61,763
40-49 years42,381
50-59 years23,274
60-69 years11,131
70-79 years5,149
80+ years2,129
RuralUrban21.1%78.9%
UrbanizationPersons
Rural113,512
Urban424,076
Urbanization (C 2014)
Rural113,512
Urban424,076
yesno44.2%55.8%
Literacy (A15+)Persons
yes154,001
no121,880
Literacy (A15+) (C 2014)
yes154,001
no121,880
PortugueseUmbunduKimbunduKikongoChokweNganguela1/344.1%47.6%
Spoken Language(s)Persons
Portuguese342,703
Umbundu22,667
Kimbundu4,259
Kikongo6,753
Chokwe370,239
Nganguela5,256
Nhaneca1,862
Fiote/Ibinda4,478
Cuanhama1,698
Luvale5,498
Muhumbi1,586
Other language8,499
Deaf-mute1,709
Spoken Language(s) (C 2014)
Portuguese342,703
Umbundu22,667
Kimbundu4,259
Kikongo6,753
Chokwe370,239
Nganguela5,256
Nhaneca1,862
Fiote/Ibinda4,478
Cuanhama1,698
Luvale5,498
Muhumbi1,586
Other language8,499
Deaf-mute1,709
CatholicProtestantIndigeno…MuslimOther rel…No religionOther25%55.5%
ReligionPersons
Catholic 66,538
Protestant298,436
Indigenous religion826
Muslim2,273
Jew730
Other religion34,636
No religion134,150
Religion (C 2014)
Catholic 66,538
Protestant298,436
Indigenous religion826
Muslim2,273
Jew730
Other religion34,636
No religion134,150

See also:

P 2022-07-01

The service has to support the EPSG:3857 projection; in case of WMTS as TileMatrixSet name.


50 km
Toggle Menu
Zoom In
Zoom Out
Change Level
Population
Density
Change
Gender
Age 65+
Literacy
Urbanization
Select Topic
Status
Change Label
Enlarge Map
Downsize Map
Hide Map
Toggle Menu
Change Base Map
Change Transparency
Undock Map
Swap Map Position
Enlarge Map
Downsize Map
Show Legend
Print Map
Indigenous religion
Other religion