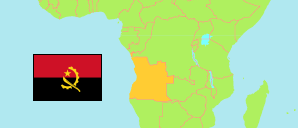
Huíla
Province in Angola
Contents: Subdivision
The population development in Huíla as well as related information and services (Wikipedia, Google, images).
| Name | Status | Population Census 2014-05-16 | Population Projection 2022-07-01 | |
|---|---|---|---|---|
| Huíla | Province | 2,497,422 | 3,185,244 | |
| Caconda | Municipality | 167,820 | 214,048 | → |
| Cacula | Municipality | 136,977 | 174,693 | → |
| Caluquembe | Municipality | 179,931 | 229,509 | → |
| Chibia | Municipality | 190,670 | 243,136 | → |
| Chicomba | Municipality | 131,807 | 168,114 | → |
| Chipindo | Municipality | 64,714 | 82,542 | → |
| Cuvango | Municipality | 78,543 | 100,187 | → |
| Gambos (Chiange) | Municipality | 79,462 | 101,308 | → |
| Humpata | Municipality | 89,144 | 113,700 | → |
| Jamba | Municipality | 105,090 | 134,035 | → |
| Lubango | Municipality | 776,249 | 990,165 | → |
| Matala | Municipality | 262,763 | 335,118 | → |
| Quilengues | Municipality | 75,334 | 96,078 | → |
| Quipungo (Tchipungo) | Municipality | 158,918 | 202,612 | → |
| Angola | Republic | 25,789,024 | 33,086,278 |
Source: Instituto Nacional de Estatística, República de Angola (web).
Explanation: Area figures of municipalities are derived from imprecise geometries.
Further information about the population structure:
| Gender (P 2022) | |
|---|---|
| Males | 1,530,465 |
| Females | 1,654,779 |
| Age Groups (C 2014) | |
|---|---|
| 0-14 years | 1,242,459 |
| 15-64 years | 1,186,773 |
| 65+ years | 68,190 |
| Age Distribution (C 2014) | |
|---|---|
| 0-9 years | 936,306 |
| 10-19 years | 542,761 |
| 20-29 years | 372,988 |
| 30-39 years | 253,231 |
| 40-49 years | 175,067 |
| 50-59 years | 113,267 |
| 60-69 years | 58,472 |
| 70-79 years | 30,106 |
| 80+ years | 15,225 |
| Urbanization (C 2014) | |
|---|---|
| Rural | 1,680,383 |
| Urban | 817,039 |
| Literacy (A15+) (C 2014) | |
|---|---|
| yes | 639,132 |
| no | 615,831 |
| Spoken Language(s) (C 2014) | |
|---|---|
| Portuguese | 1,237,383 |
| Umbundu | 735,050 |
| Kimbundu | 15,891 |
| Kikongo | 11,958 |
| Chokwe | 32,285 |
| Nganguela | 134,885 |
| Nhaneca | 540,145 |
| Fiote/Ibinda | 13,080 |
| Cuanhama | 11,904 |
| Luvale | 5,755 |
| Muhumbi | 240,157 |
| Deaf-mute | 6,691 |
| Other language | 20,086 |
| Religion (C 2014) | |
|---|---|
| Catholics | 1,514,164 |
| Protestants | 630,450 |
| Indigenous religion | 2,538 |
| Muslims | 2,190 |
| Jews | 5,952 |
| Other religion | 68,403 |
| No religion | 273,726 |
