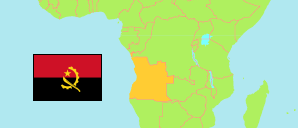
HomeAdministrative Division
Tweet
Facebook
Show Map

Cuando Cubango

Province in Angola

Contents: Subdivision

The population development in Cuando Cubango as well as related information and services (Wikipedia, Google, images).

The Details icon links to further information about a selected division including its population structure (gender, age groups, age distribution, urbanization, literacy (a15+), spoken language(s), religion).

NameStatusPopulation
Census
2014-05-16
Population
Projection
2022-07-01
Cuando CubangoProvince534,002677,430
CalaiMunicipality22,65428,741
CuangarMunicipality28,45936,106
CuchiMunicipality42,97454,505
Cuito CuanavaleMunicipality40,82951,797
DiricoMunicipality15,12619,191
MavingaMunicipality27,19634,512
MenongueMunicipality320,914407,100
NancovaMunicipality2,7963,548
RivungoMunicipality33,05341,930
AngolaRepublic25,789,02433,086,278

Source: Instituto Nacional de Estatística, República de Angola (web).

Explanation: Area figures of municipalities are derived from imprecise geometries.


Further information about the population structure:

MalesFemales49.1%50.9%
GenderPersons
Males332,329
Females345,101
Gender (P 2022)
Males332,329
Females345,101
0-14 years15-64years65+ years46.4%50.8%
Age GroupsPersons
0-14 years247,753
15-64 years271,210
65+ years15,038
Age Groups (C 2014)
0-14 years247,753
15-64 years271,210
65+ years15,038
0-9 years10-19 years20-29 years30-39 years40-49 years50-59 years60-69 years70-79 years80+ years
Age DistributionPersons
0-9 years187,954
10-19 years113,935
20-29 years93,126
30-39 years54,791
40-49 years36,304
50-59 years24,562
60-69 years12,863
70-79 years6,973
80+ years3,492
Age Distribution (C 2014)
0-9 years187,954
10-19 years113,935
20-29 years93,126
30-39 years54,791
40-49 years36,304
50-59 years24,562
60-69 years12,863
70-79 years6,973
80+ years3,492
RuralUrban43%57%
UrbanizationPersons
Rural229,451
Urban304,551
Urbanization (C 2014)
Rural229,451
Urban304,551
yesno44.1%55.9%
Literacy (A15+)Persons
yes160,145
no126,104
Literacy (A15+) (C 2014)
yes160,145
no126,104
PortugueseUmbunduKimbunduKikongoChokweNganguela1/334.1%35.8%
Spoken Language(s)Persons
Portuguese252,315
Umbundu89,504
Kimbundu4,373
Kikongo6,618
Chokwe68,542
Nganguela264,639
Nhaneca6,299
Fiote/Ibinda6,329
Cuanhama3,533
Luvale902
Muhumbi1,377
Other language25,506
Deaf-mute8,923
Spoken Language(s) (C 2014)
Portuguese252,315
Umbundu89,504
Kimbundu4,373
Kikongo6,618
Chokwe68,542
Nganguela264,639
Nhaneca6,299
Fiote/Ibinda6,329
Cuanhama3,533
Luvale902
Muhumbi1,377
Other language25,506
Deaf-mute8,923
CatholicProtestantOtherreligionNo religionOther44.2%46.8%
ReligionPersons
Catholic 235,964
Protestant249,693
Indigenous religion166
Muslim605
Jew732
Other religion18,742
No religion28,100
Religion (C 2014)
Catholic 235,964
Protestant249,693
Indigenous religion166
Muslim605
Jew732
Other religion18,742
No religion28,100

See also:

The service has to support the EPSG:3857 projection; in case of WMTS as TileMatrixSet name.


50 km
Toggle Menu
Zoom In
Zoom Out
Change Level
Population
Density
Change
Gender
Age 65+
Literacy
Urbanization
Select Topic
Status
Change Label
Enlarge Map
Downsize Map
Hide Map
Toggle Menu
Change Base Map
Change Transparency
Undock Map
Swap Map Position
Enlarge Map
Downsize Map
Show Legend
Print Map