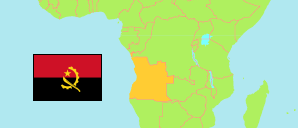
HomeAdministrative Division
Tweet
Facebook
Show Map

Cabinda

Province in Angola

Contents: Subdivision

The population development in Cabinda as well as related information and services (Wikipedia, Google, images).

The Details icon links to further information about a selected division including its population structure (gender, age groups, age distribution, urbanization, literacy (a15+), spoken language(s), religion).

NameStatusPopulation
Census
2014-05-16
Population
Projection
2022-07-01
CabindaProvince716,076894,276
BelizeMunicipality19,56124,430
Buco ZauMunicipality32,79240,953
CabindaMunicipality624,646780,093
Cacongo (Landana)Municipality39,07648,801
AngolaRepublic25,789,02433,086,278

Source: Instituto Nacional de Estatística, República de Angola (web).

Explanation: Area figures of municipalities are derived from imprecise geometries.


Further information about the population structure:

MalesFemales49.7%50.3%
GenderPersons
Males444,529
Females449,747
Gender (P 2022)
Males444,529
Females449,747
0-14 years15-64years65+ years43.6%54.8%
Age GroupsPersons
0-14 years311,895
15-64 years392,407
65+ years11,771
Age Groups (C 2014)
0-14 years311,895
15-64 years392,407
65+ years11,771
0-9 years10-19 years20-29 years30-39 years40-49 years50-59 years60-69 years70-79 years80+ years
Age DistributionPersons
0-9 years229,995
10-19 years151,911
20-29 years129,519
30-39 years100,679
40-49 years56,040
50-59 years28,677
60-69 years11,934
70-79 years5,140
80+ years2,178
Age Distribution (C 2014)
0-9 years229,995
10-19 years151,911
20-29 years129,519
30-39 years100,679
40-49 years56,040
50-59 years28,677
60-69 years11,934
70-79 years5,140
80+ years2,178
RuralUrban82.9%
UrbanizationPersons
Rural122,181
Urban593,894
Urbanization (C 2014)
Rural122,181
Urban593,894
yesno20.2%79.8%
Literacy (A15+)Persons
yes322,479
no81,702
Literacy (A15+) (C 2014)
yes322,479
no81,702
PortugueseUmbunduKimbunduKikongoChokweNganguela1/231.7%59.2%
Spoken Language(s)Persons
Portuguese545,446
Umbundu16,496
Kimbundu4,241
Kikongo28,699
Chokwe2,175
Nganguela1,644
Nhaneca918
Fiote/Ibinda292,421
Cuanhama3,446
Luvale517
Muhumbi486
Other language24,151
Deaf-mute913
Spoken Language(s) (C 2014)
Portuguese545,446
Umbundu16,496
Kimbundu4,241
Kikongo28,699
Chokwe2,175
Nganguela1,644
Nhaneca918
Fiote/Ibinda292,421
Cuanhama3,446
Luvale517
Muhumbi486
Other language24,151
Deaf-mute913
CatholicProtestantIndigeno…MuslimJewOther rel…No religion48.3%31.7%
ReligionPersons
Catholic 346,033
Protestant226,833
Indigenous religion1,064
Muslim1,393
Jew1,181
Other religion96,354
No religion43,218
Religion (C 2014)
Catholic 346,033
Protestant226,833
Indigenous religion1,064
Muslim1,393
Jew1,181
Other religion96,354
No religion43,218

See also:

P 2022-07-01

The service has to support the EPSG:3857 projection; in case of WMTS as TileMatrixSet name.


50 km
Toggle Menu
Zoom In
Zoom Out
Change Level
Population
Density
Change
Gender
Age 65+
Literacy
Urbanization
Select Topic
Status
Change Label
Enlarge Map
Downsize Map
Hide Map
Toggle Menu
Change Base Map
Change Transparency
Undock Map
Swap Map Position
Enlarge Map
Downsize Map
Show Legend
Print Map
Indigenous religion
Other religion