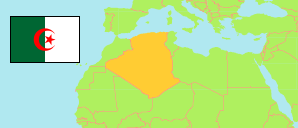
Aïn Defla
Province in Algeria
Contents: Subdivision
The population development in Aïn Defla as well as related information and services (Wikipedia, Google, images).
| Name | Status | Native | Population Census 1998-06-25 | Population Census 2008-04-14 | |
|---|---|---|---|---|---|
| Aïn Defla | Province | عين الدفلى | 660,342 | 766,013 | |
| Aïn Benian | Commune | عين البنيان | 4,677 | 5,488 | → |
| Aïn Bouyahia | Commune | عين بويحى | 13,920 | 16,213 | → |
| Aïn Defla | Province Capital | عين الدفلى | 52,276 | 65,453 | → |
| Aïn Lechiekh | Commune | عين الاشياخ | 12,119 | 13,745 | → |
| Aïn Soltane | Commune | عين السلطان | 18,541 | 21,565 | → |
| Aïn Torki | Commune | عين التركى | 8,280 | 9,546 | → |
| Arib | Commune | عريب | 20,782 | 24,980 | → |
| Bathia | Commune | بطحية | 5,919 | 6,238 | → |
| Belaas | Commune | بالعاص | 5,303 | 5,452 | → |
| Ben Allal | Commune | بن علال | 7,979 | 9,068 | → |
| Birbouche | Commune | بربوش | 4,686 | 4,897 | → |
| Bir Ould Khelifa | Commune | بئر أولاد خليفة | 10,568 | 12,846 | → |
| Bordj Emir Khaled | Commune | برج الامير خالد | 7,201 | 8,598 | → |
| Boumedfaa | Commune | بومدفع | 17,898 | 21,509 | → |
| Bourached | Commune | بوراشد | 25,844 | 29,680 | → |
| Djelida | Commune | جليدة | 30,371 | 36,076 | → |
| Djemaa Ouled Cheikh | Commune | جمعة أولاد الشيخ | 6,987 | 7,534 | → |
| Djendel | Commune | جندل | 26,849 | 30,170 | → |
| El Abadia | Commune | العبادية | 33,221 | 40,697 | → |
| El Amra | Commune | العامرة | 25,890 | 31,073 | → |
| El Attaf | Commune | العطاف | 50,197 | 57,737 | → |
| El Hassania | Commune | الحسنية | 4,389 | 4,037 | → |
| El Maine | Commune | الماين | 11,319 | 12,835 | → |
| Hammam Righa | Commune | حمام ريغة | 7,133 | 8,488 | → |
| Hoceinia | Commune | حسينية | 7,617 | 7,799 | → |
| Khemis Miliana | Commune | خميس مليانة | 74,349 | 84,574 | → |
| Mekhatria | Commune | المختارية | 14,963 | 17,129 | → |
| Miliana | Commune | مليانة | 39,662 | 44,201 | → |
| Oued Chorfa | Commune | وادى الشرفاء | 11,960 | 13,353 | → |
| Oued Djemaa | Commune | وادى جمعة | 9,891 | 9,555 | → |
| Rouina | Commune | روينة | 17,437 | 21,572 | → |
| Sidi Lakhdar | Commune | سيدي الاخضر | 16,902 | 20,970 | → |
| Tacheta Zougagha | Commune | تاشتة زقاغة | 19,711 | 23,397 | → |
| Tarik Ibn Ziad | Commune | طارق بن زياد | 9,739 | 10,285 | → |
| Tiberkanine | Commune | تبركانين | 14,907 | 16,384 | → |
| Zeddine | Commune | زدين | 10,853 | 12,870 | → |
| Algérie [Algeria] | Republic | الجزائر | 29,100,867 | 34,080,030 |
Source: Office National des Statistiques de l'Algérie (web).
Further information about the population structure:
| Gender (C 2008) | |
|---|---|
| Males | 388,776 |
| Females | 377,236 |
| Age Groups (C 2008) | |
|---|---|
| 0-14 years | 219,433 |
| 15-64 years | 508,060 |
| 65+ years | 37,754 |
| Age Distribution (C 2008) | |
|---|---|
| 0-9 years | 143,368 |
| 10-19 years | 165,819 |
| 20-29 years | 168,884 |
| 30-39 years | 109,763 |
| 40-49 years | 74,412 |
| 50-59 years | 50,144 |
| 60-69 years | 28,558 |
| 70-79 years | 18,136 |
| 80+ years | 6,163 |
| Clustering (C 2008) | |
|---|---|
| in main locality | 450,278 |
| in other settlements | 171,607 |
| scattered | 144,129 |