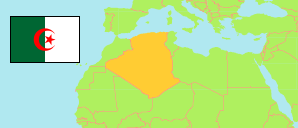
Tipaza
Province in Algeria
Contents: Subdivision
The population development in Tipaza as well as related information and services (Wikipedia, Google, images).
| Name | Status | Native | Population Census 1998-06-25 | Population Census 2008-04-14 | |
|---|---|---|---|---|---|
| Tipaza | Province | تيبازة | 506,053 | 591,010 | |
| Aghbal | Commune | أغابال | 6,606 | 7,122 | → |
| Ahmar El Aïn | Commune | أحمر العين | 25,633 | 29,566 | → |
| Aïn Tagourait | Commune | عين تقورايت | 9,075 | 10,411 | → |
| Attatba | Commune | الحطاطبة | 22,002 | 27,059 | → |
| Beni Milleuk | Commune | بني ملوك | 6,890 | 8,045 | → |
| Bouharoun | Commune | بوهارون | 8,613 | 9,922 | → |
| Bou Ismaïl | Commune | بواسماعيل | 38,445 | 41,684 | → |
| Bourkika | Commune | بورقيقة | 18,810 | 22,118 | → |
| Chaiba | Commune | الشعيبة | 16,376 | 20,427 | → |
| Cherchell | Commune | شرشال | 40,763 | 48,056 | → |
| Damous | Commune | الداموس | 14,432 | 17,111 | → |
| Douaouda | Commune | دواودة | 17,283 | 22,408 | → |
| Fouka | Commune | فوكة | 39,549 | 48,959 | → |
| Gouraya | Commune | قوراية | 17,165 | 20,144 | → |
| Hadjeret Ennous | Commune | حجرة النص | 1,739 | 2,150 | → |
| Hadjout | Commune | حجوط | 44,065 | 48,561 | → |
| Khemisti | Commune | خميستي | 12,622 | 15,128 | → |
| Koléa | Commune | القليعة | 46,158 | 54,401 | → |
| Larhat | Commune | الأرهاط | 6,736 | 7,359 | → |
| Menaceur | Commune | مناصرة | 22,684 | 25,480 | → |
| Merad | Commune | مراد | 18,104 | 19,916 | → |
| Messelmoun | Commune | مسلمون | 6,603 | 7,564 | → |
| Nador | Commune | الناظور | 8,018 | 9,588 | → |
| Sidi Amar | Commune | سيدي عمر | 10,906 | 13,332 | → |
| Sidi Ghiles | Commune | سيدي غيلاس | 12,731 | 15,281 | → |
| Sidi Rached | Commune | سيدي راشد | 9,153 | 11,062 | → |
| Sidi Semiane | Commune | سيدي سميان | 2,978 | 2,930 | → |
| Tipaza | Province Capital | تيبازة | 21,915 | 25,225 | → |
| Algérie [Algeria] | Republic | الجزائر | 29,100,867 | 34,080,030 |
Source: Office National des Statistiques de l'Algérie (web).
Further information about the population structure:
| Gender (C 2008) | |
|---|---|
| Males | 298,885 |
| Females | 292,125 |
| Age Groups (C 2008) | |
|---|---|
| 0-14 years | 158,667 |
| 15-64 years | 399,219 |
| 65+ years | 32,029 |
| Age Distribution (C 2008) | |
|---|---|
| 0-9 years | 105,721 |
| 10-19 years | 113,427 |
| 20-29 years | 121,240 |
| 30-39 years | 93,669 |
| 40-49 years | 67,859 |
| 50-59 years | 42,534 |
| 60-69 years | 24,958 |
| 70-79 years | 15,479 |
| 80+ years | 5,028 |
| Clustering (C 2008) | |
|---|---|
| in main locality | 343,838 |
| in other settlements | 114,798 |
| scattered | 132,373 |
