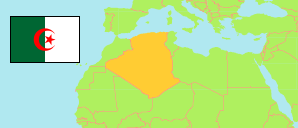
Khenchela
Province in Algeria
Contents: Subdivision
The population development in Khenchela as well as related information and services (Wikipedia, Google, images).
| Name | Status | Native | Population Census 1998-06-25 | Population Census 2008-04-14 | |
|---|---|---|---|---|---|
| Khenchela | Province | خنشلة | 327,917 | 386,683 | |
| Aïn Touila | Commune | عين الطويلة | 14,769 | 16,845 | → |
| Babar | Commune | بابار | 28,182 | 34,844 | → |
| Baghaï | Commune | بغاى | 6,414 | 6,676 | → |
| Bouhmama | Commune | بوحمامة | 9,669 | 10,614 | → |
| Chechar | Commune | ششار | 21,468 | 27,428 | → |
| Chélia | Commune | شلية | 4,851 | 4,953 | → |
| Djellal | Commune | جلال | 3,637 | 3,089 | → |
| El Hamma | Commune | الحامة | 10,702 | 12,051 | → |
| El Mahmal | Commune | المحمل | 30,484 | 38,706 | → |
| El Oueldja | Commune | الولجة | 3,357 | 3,124 | → |
| Ensigha | Commune | انسيغة | 7,894 | 9,257 | → |
| Kais | Commune | قايس | 28,724 | 34,383 | → |
| Khenchela | Province Capital | خنشلة | 87,196 | 108,580 | → |
| Khirane | Commune | خيران | 5,350 | 5,752 | → |
| M'Sara | Commune | أمصارة | 4,194 | 4,104 | → |
| M'Toussa | Commune | متوسة | 5,538 | 5,981 | → |
| Ouled Rechache | Commune | أولاد رشاش | 22,509 | 24,923 | → |
| Remila | Commune | الرميلة | 5,740 | 5,606 | → |
| Tamza | Commune | تامزة | 8,580 | 8,617 | → |
| Taouzient | Commune | تاوزيانات | 9,794 | 10,748 | → |
| Yabous | Commune | يابوس | 8,868 | 10,402 | → |
| Algérie [Algeria] | Republic | الجزائر | 29,100,867 | 34,080,030 |
Source: Office National des Statistiques de l'Algérie (web).
Further information about the population structure:
| Gender (C 2008) | |
|---|---|
| Males | 195,502 |
| Females | 191,182 |
| Age Groups (C 2008) | |
|---|---|
| 0-14 years | 114,845 |
| 15-64 years | 252,614 |
| 65+ years | 19,073 |
| Age Distribution (C 2008) | |
|---|---|
| 0-9 years | 74,515 |
| 10-19 years | 83,761 |
| 20-29 years | 82,299 |
| 30-39 years | 53,417 |
| 40-49 years | 39,685 |
| 50-59 years | 27,018 |
| 60-69 years | 13,330 |
| 70-79 years | 9,135 |
| 80+ years | 3,372 |
| Clustering (C 2008) | |
|---|---|
| in main locality | 288,846 |
| in other settlements | 16,503 |
| scattered | 81,334 |
